
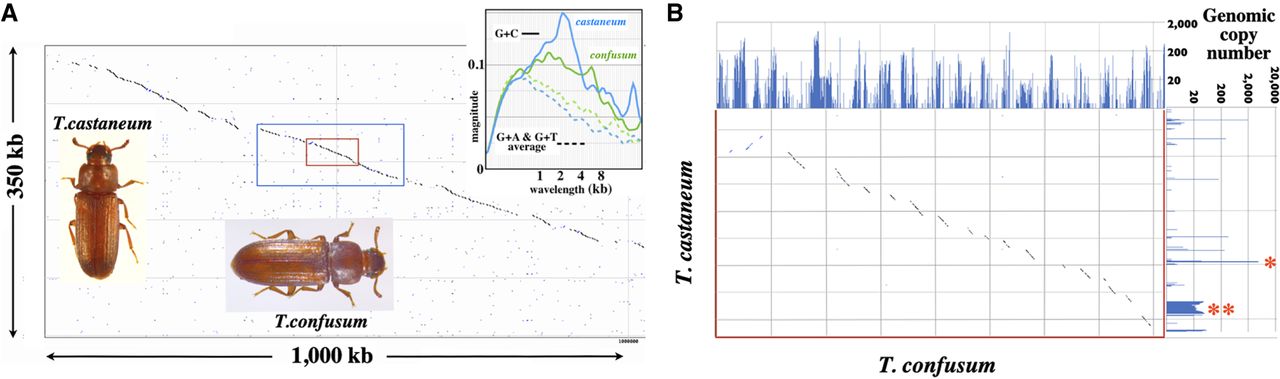
T. castaneum/T. confusum comparison. (A) Pustell DNA dot matrix comparison of the two genomes across a segment of T. castaneum LG2 (11.872–12.222 Mb). Dots indicate identity of ≥18 of 20 bases. The two genomic segments are largely collinear, except that the T. confusum segment is approximately threefold longer. The upper right inset shows the GC% magnitude graphs for these two species across 1-Mb segments in this region. The blue box encloses the LOC662726 transcription unit. The inner red box encloses a ∼30 kb region of T. castaneum, all of which is intronic except for the 600-bp protein-coding third exon. The beetle photos are by Merrilee S. Haas, used with permission. (B) Expansion of the red boxed region in A. The homologous segments are successively offset in the T. confusum genome. Above and to the right of the dot matrix are bar graphs showing the DNA copy number across this region (18 base segments incremented by nine bases) in the T. confusum and T. castaneum genomes, respectively. The single red asterisk marks a T. castaneum TTA triplet repeat, and the double red asterisk marks a T. castaneum repetitive element with homologies with R97, R163, and R287 of the list in Wang et al. (2008).


