
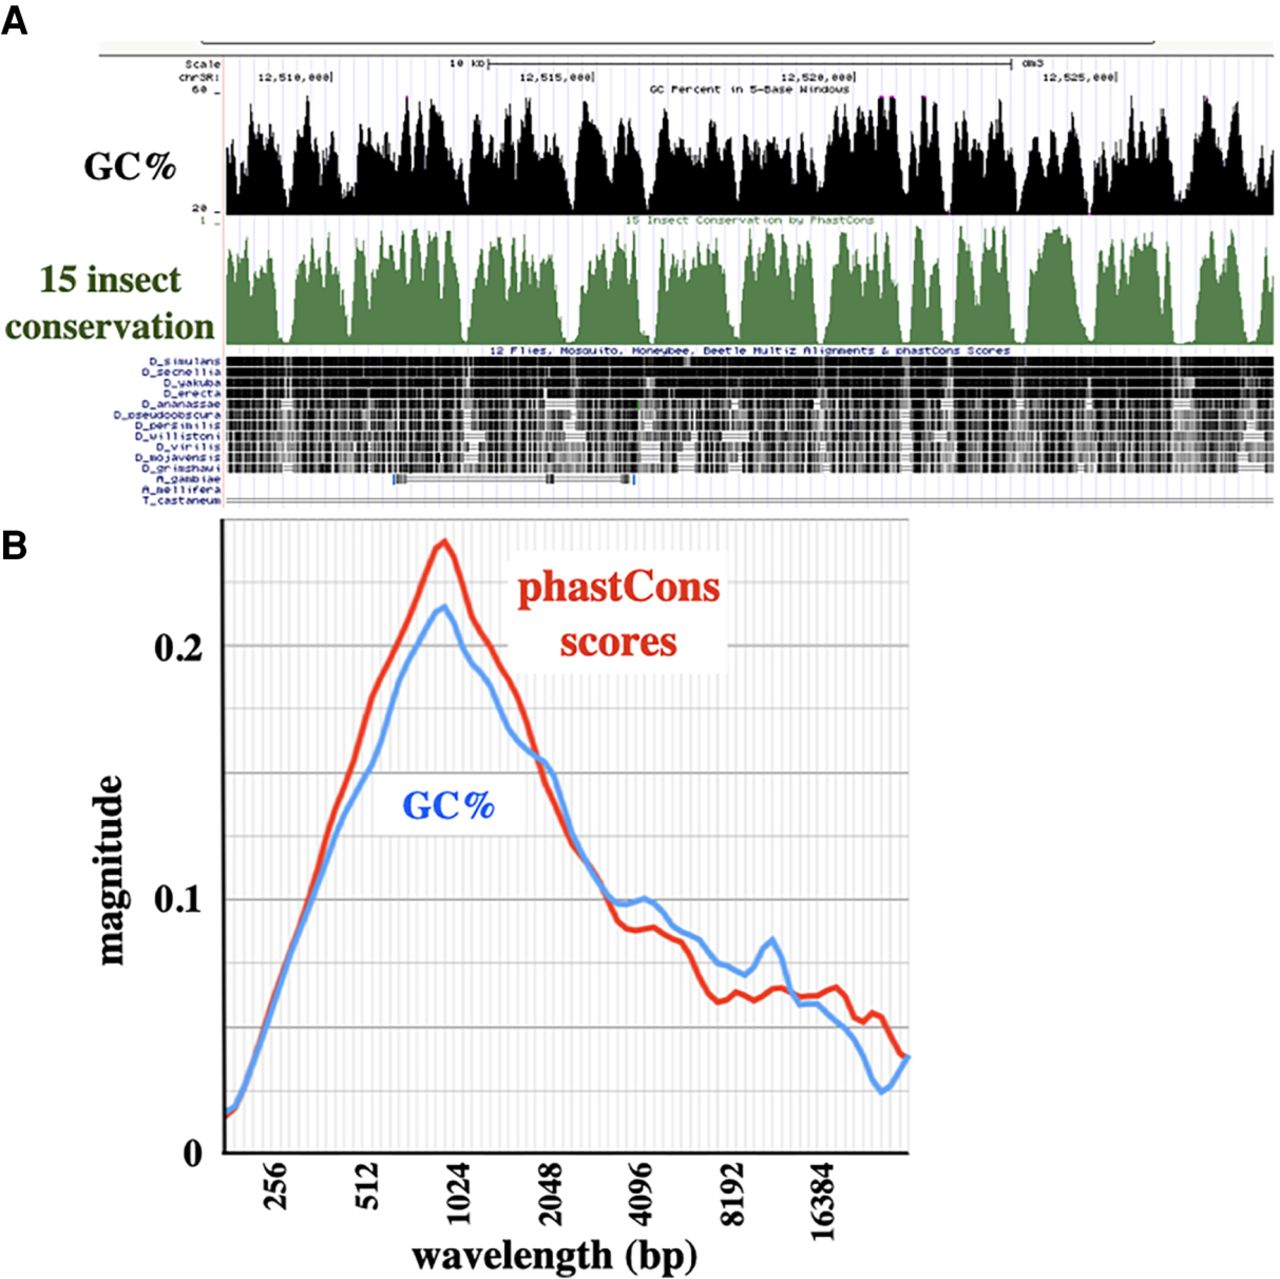
Figure 6.
Oscillation in conservation. (A) UCSC Genome Browser screen capture of a 20-kb segment in an intronic region of the D. melanogaster bithorax complex, showing the alignment between GC% and phastCons scores of sequence conservation. (B) Magnitude graph of phastCons scores across D. melanogaster Chromosome 3R: 6–7 Mb. Individual base conservation scores were averaged across a 200 base sliding window and analyzed with the continuous wavelet transform. The GC% magnitude graph for the same interval is plotted in blue, as in Figure 4. An alternative method for plotting CWT magnitudes shows a similar correspondence between GC% and phastCons scores (Supplemental Fig. S6B).


