
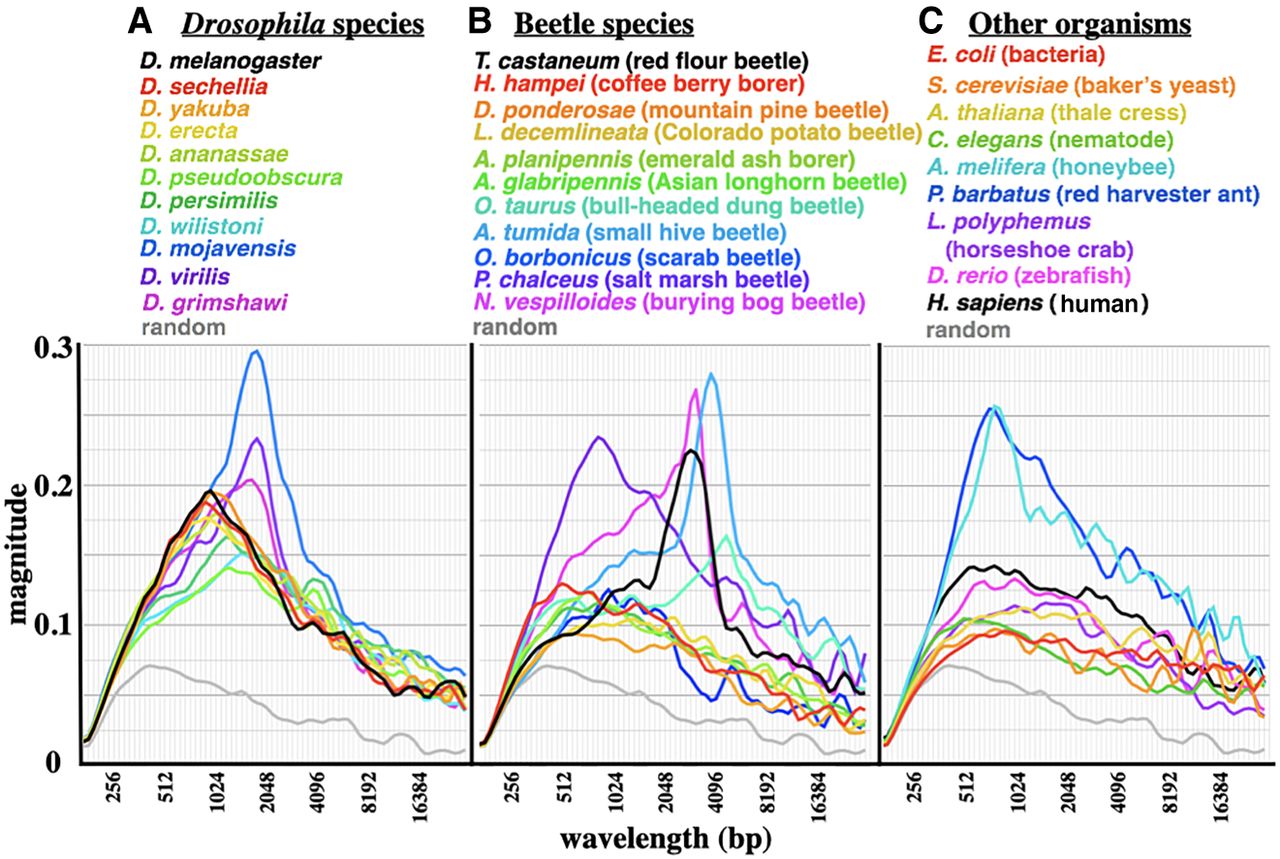
Figure 5.
Magnitude graphs for various species. (A) Eleven Drosophila species (in order of evolutionary distance from D. melanogaster, red to purple). (B) Eleven beetle species. (C) Nine diverse organisms, from bacteria to mammals. Sequences analyzed were centered on homologs of D. melanogaster Ultrabithorax (where available) and covered 1 Mb (where contiguous sequences extended that far). Clear GC% oscillations are apparent in many insects, but not in the non-insect species shown here.


