
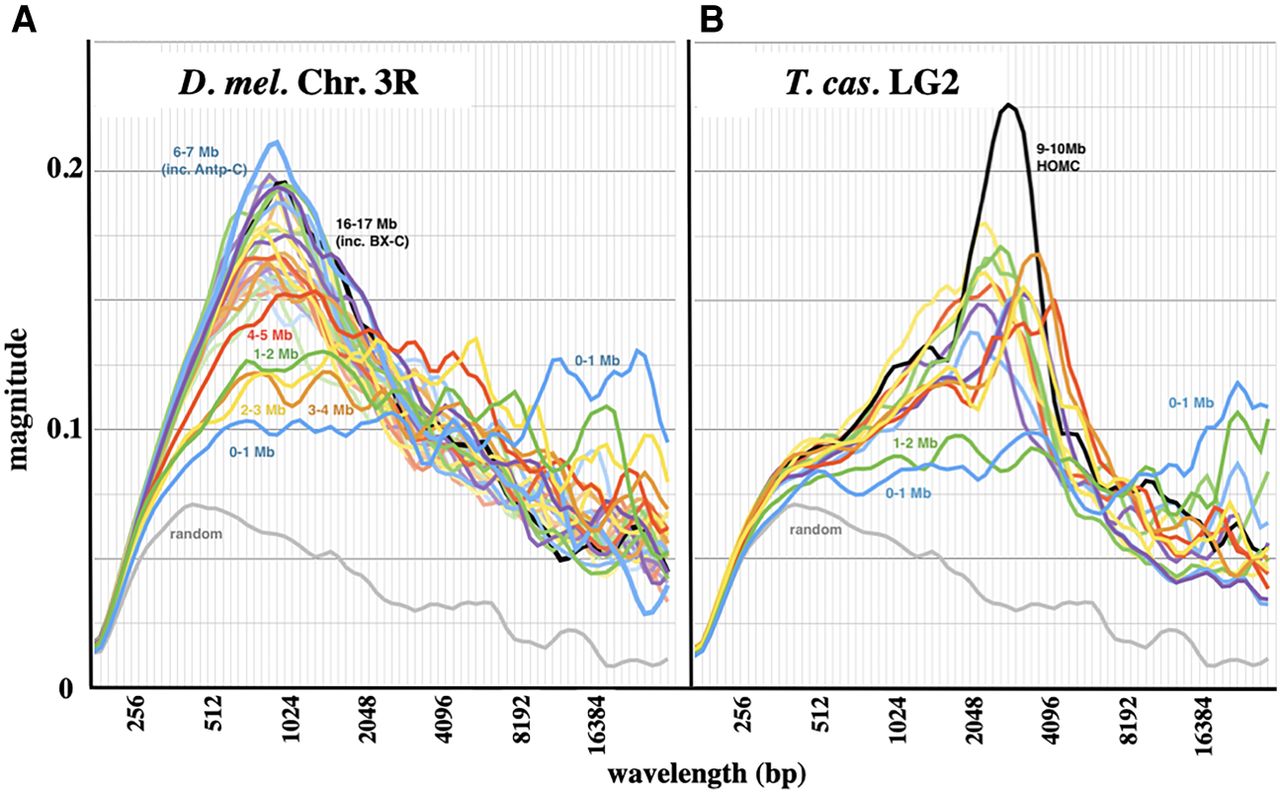
Chromosome-wide distribution of oscillations. (A) Average magnitude as a function of wavelength for 32 successive 1-Mb segments along Chromosome 3R of D. melanogaster. The first five 1-Mb segments encompass centric heterochromatin, with a high density of repetitive sequences; this region shows weak oscillation. The remaining 27 1-Mb segments all show peak wavelengths of ∼1 kb. The strongest signal comes from the 6–7 Mb segment, which includes the ∼390 kb Antennapedia complex. The 16–17 Mb segment, which includes the ∼315 kb bithorax complex, is also prominent. (B) Average magnitude for 15 successive 1-Mb segments of T. castaneum LG2. Again, the 0–1 and 1–2 Mb segments are highly repetitive and show weak oscillation, and the other 13 segments show stronger signals at wavelengths of ∼2.5 kb. The 8–9 Mb segment, which includes the HOMC, shows the strongest signal.


