
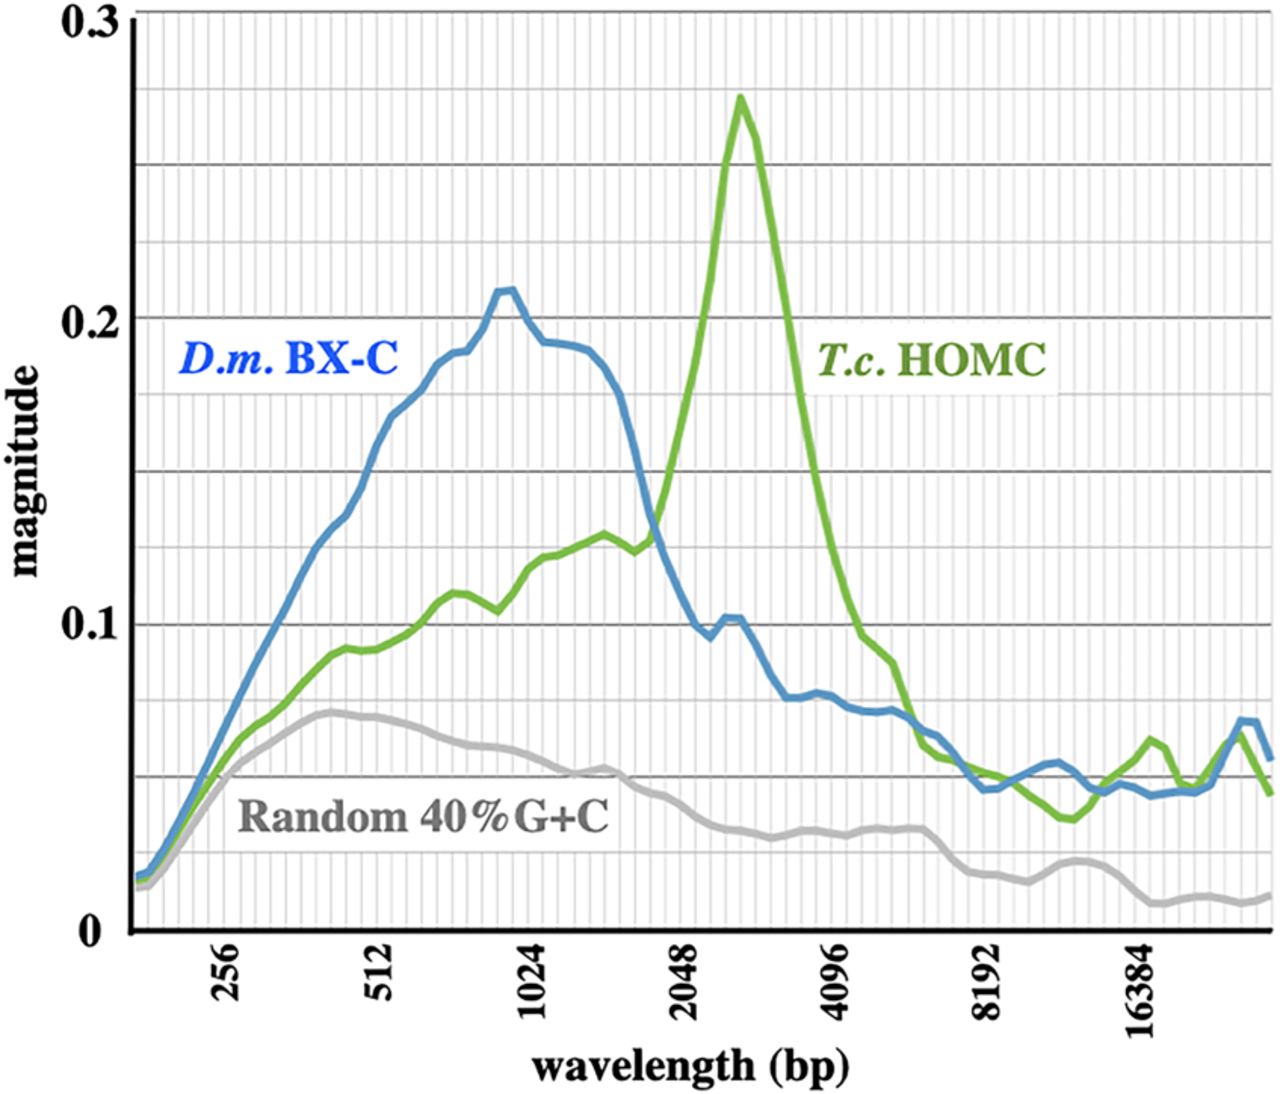
Figure 3.
Average magnitude graphs of the continuous wavelet transforms shown in Figure 2. The magnitude metric on the y-axis shows the signal strength relative to that of a perfect sine wave.
(Downloading may take up to 30 seconds. If the slide opens in your browser, select File -> Save As to save it.)
Click on image to view larger version.
Average magnitude graphs of the continuous wavelet transforms shown in Figure 2. The magnitude metric on the y-axis shows the signal strength relative to that of a perfect sine wave.
 CiteULike
 Delicious
 Digg
Digg Facebook
 Google+
 Reddit
 Twitter
