
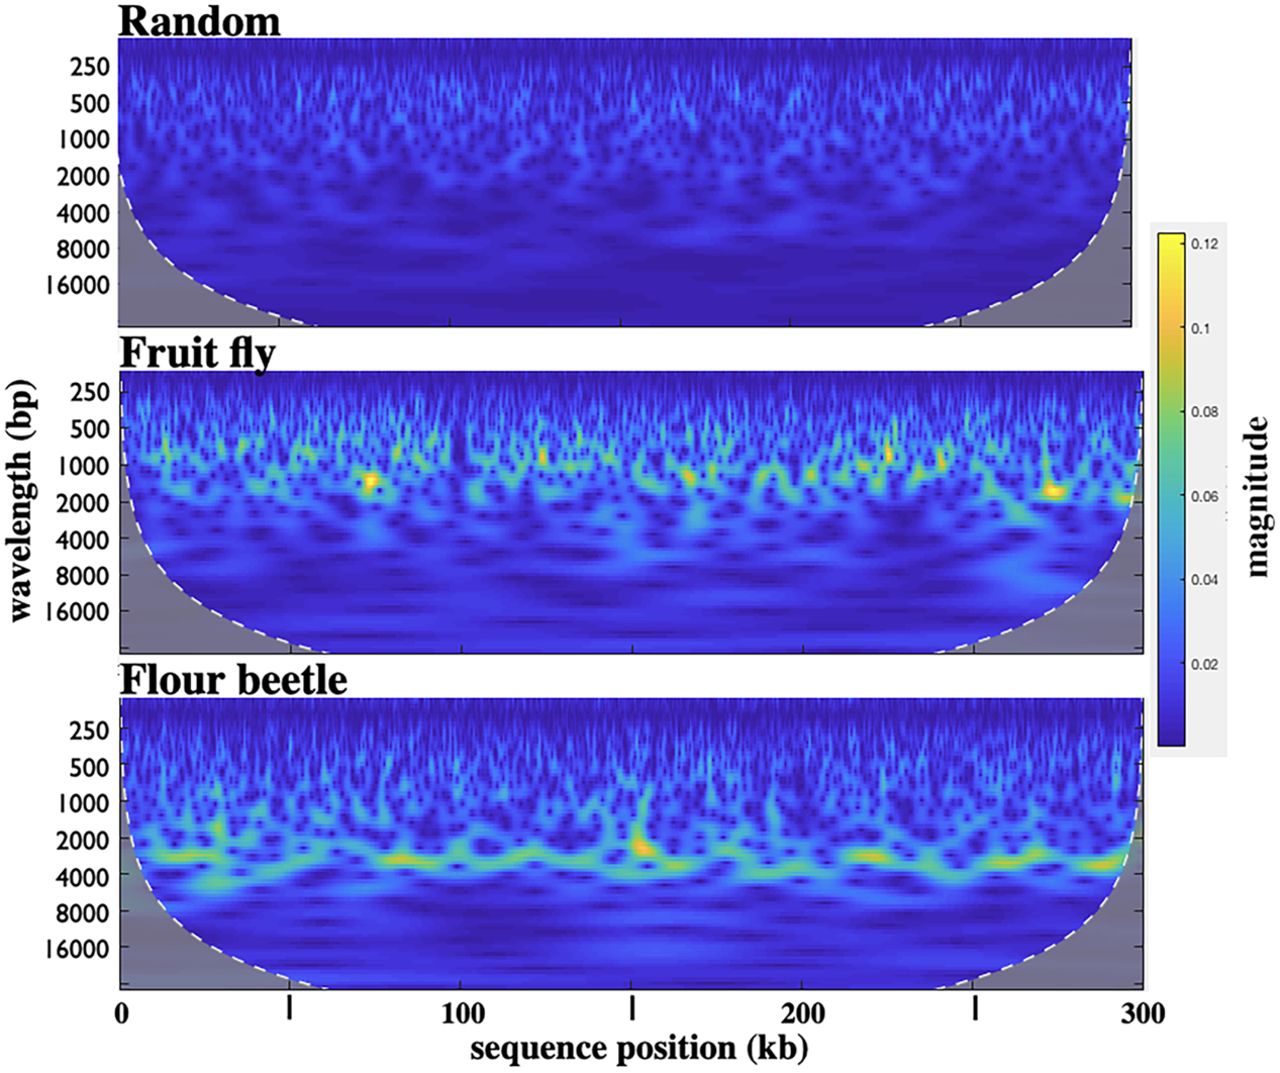
Figure 2.
Heatmaps from continuous wavelet transforms for 300-kb segments of randomly shuffled sequence (40% G + C), of the Drosophila bithorax complex (D. melanogaster 3R 16.66–16.96 Mb), and of the Tribolium homeotic complex (T. castaneum LG2 7.971–8.271 Mb). The magnitude bar on the right shows the linearity of the color scale. The yellow highlights in the heatmaps indicate a predominant oscillation wavelength of ∼1 kb for the fruit fly and ∼2.5 kb for the flour beetle.


