
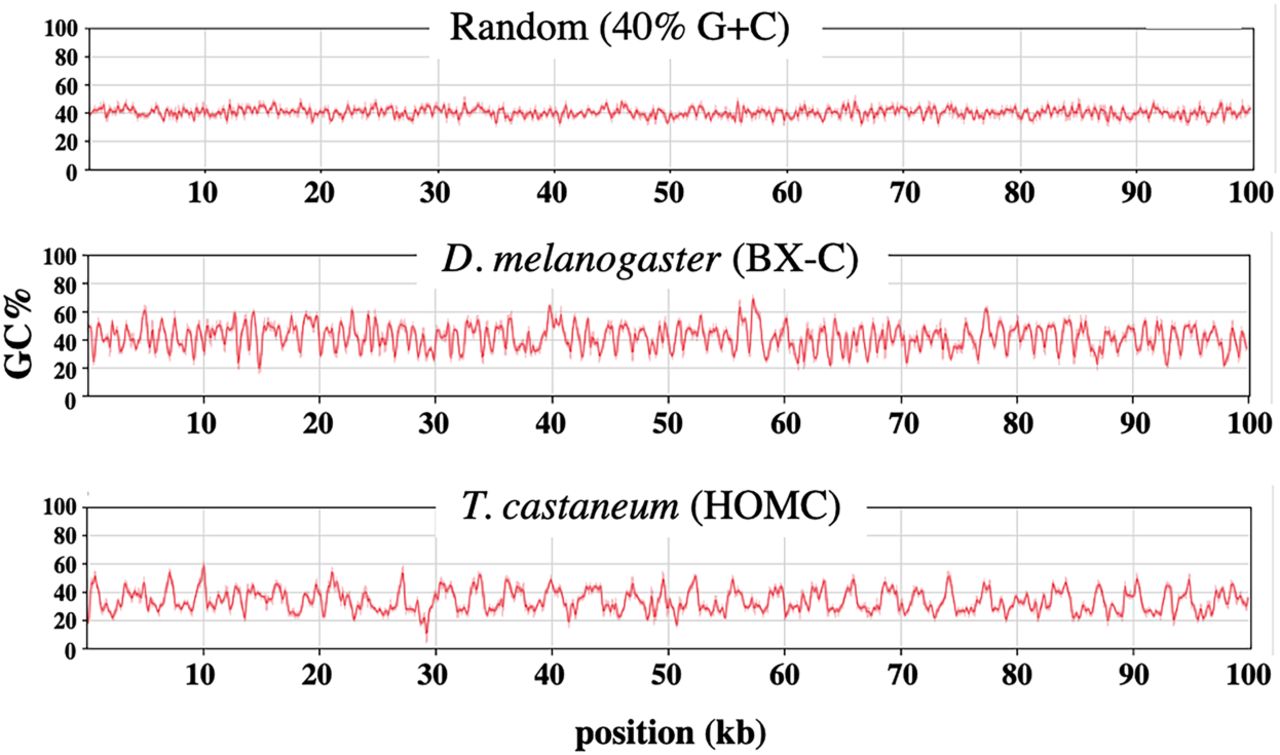
Figure 1.
Oscillations in base composition. GC% is plotted for a 200-base sliding window across 100-kb DNA segments, as implemented with the MacVector DNA analysis software. The DNA segments are centered on the abd-A genes (D. melanogaster 3R 16.77–16.87 Mb; T. castaneum LG2 8.021–8.121 Mb).


