
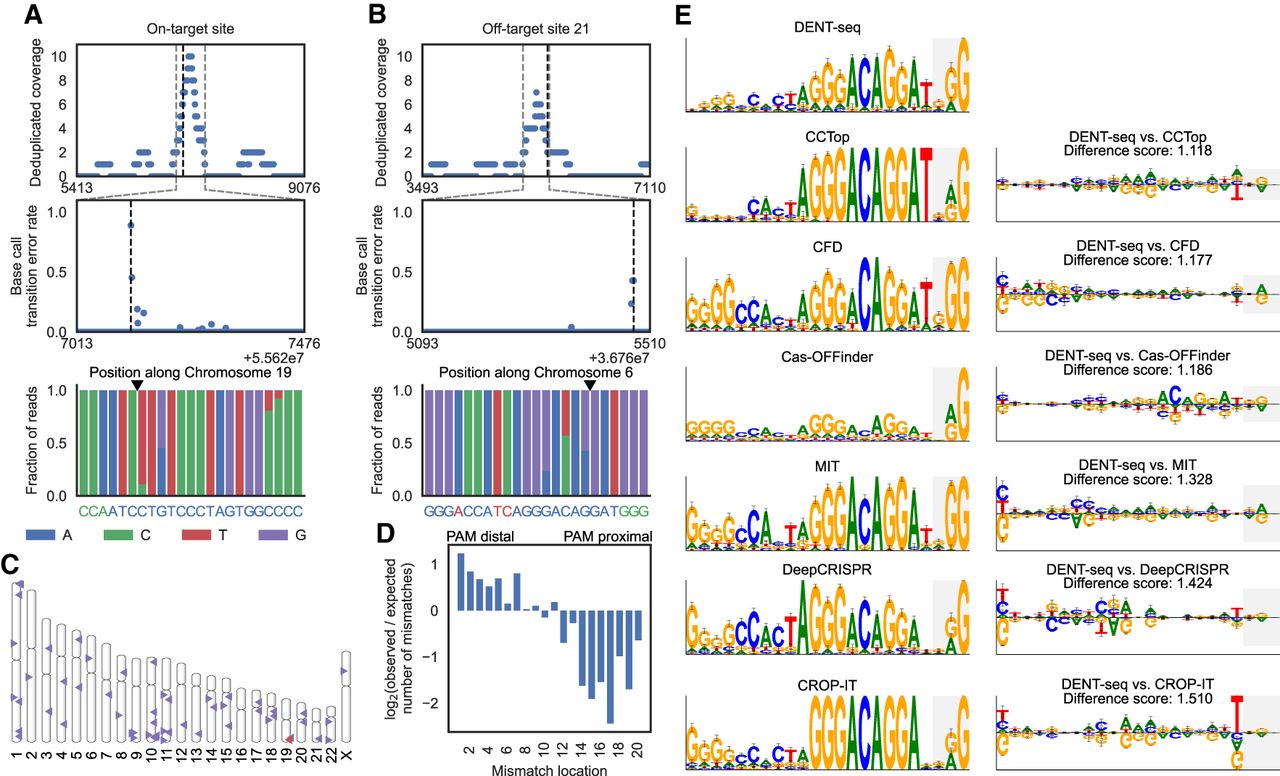
Detection and analysis of D10A spCas9 nickase on- and off-target activity in human genomic DNA. (A) D10A spCas9 nickase single-site on-target activity is represented by the most prominent MACS2 peak, denoted by the gray dashed lines, which also contains strong mutation signal. The reverse complement of the guide sequence is shown in blue with the PAM in green at bottom. (B) One of the five off-target nicks that were identified without using a priori knowledge of expected off-target sites. Gray lines mark the MACS2 peak bounds. At bottom, the genomic sequence where the guide RNA binds is shown in blue with mismatches in red. (C) Ideogram showing the site of on-target activity in red and candidate off-target sites with DENT-seq mutational signal in purple. (D) Comparison of the frequency of mismatch locations in the guide RNA at the sites of detected off-target activity to all potential sites proposed by Cas-OFFinder. (E) Sequence motifs created from the sites with evidence of D10A spCas9 nickase off-target activity and the top hits predicted by multiple Cas9 off-target predictors (left). The motif for the sites identified by DENT-seq is compared to the motifs for each of the software predictions using DiffLogo (right). The bases composing the PAM sequence are shown with a light gray background. Dispersion metrics for the prediction software sequence logos were generated by performing 10,000 bootstrap resamples of the entire list of potential off-target sites proposed by each algorithm and calculating the position probability matrix for the highest rated 52 sites in each resample. Ninety percent confidence intervals for the frequency of each base at each position are displayed under the assumption that the information content at each position remains unchanged.


