
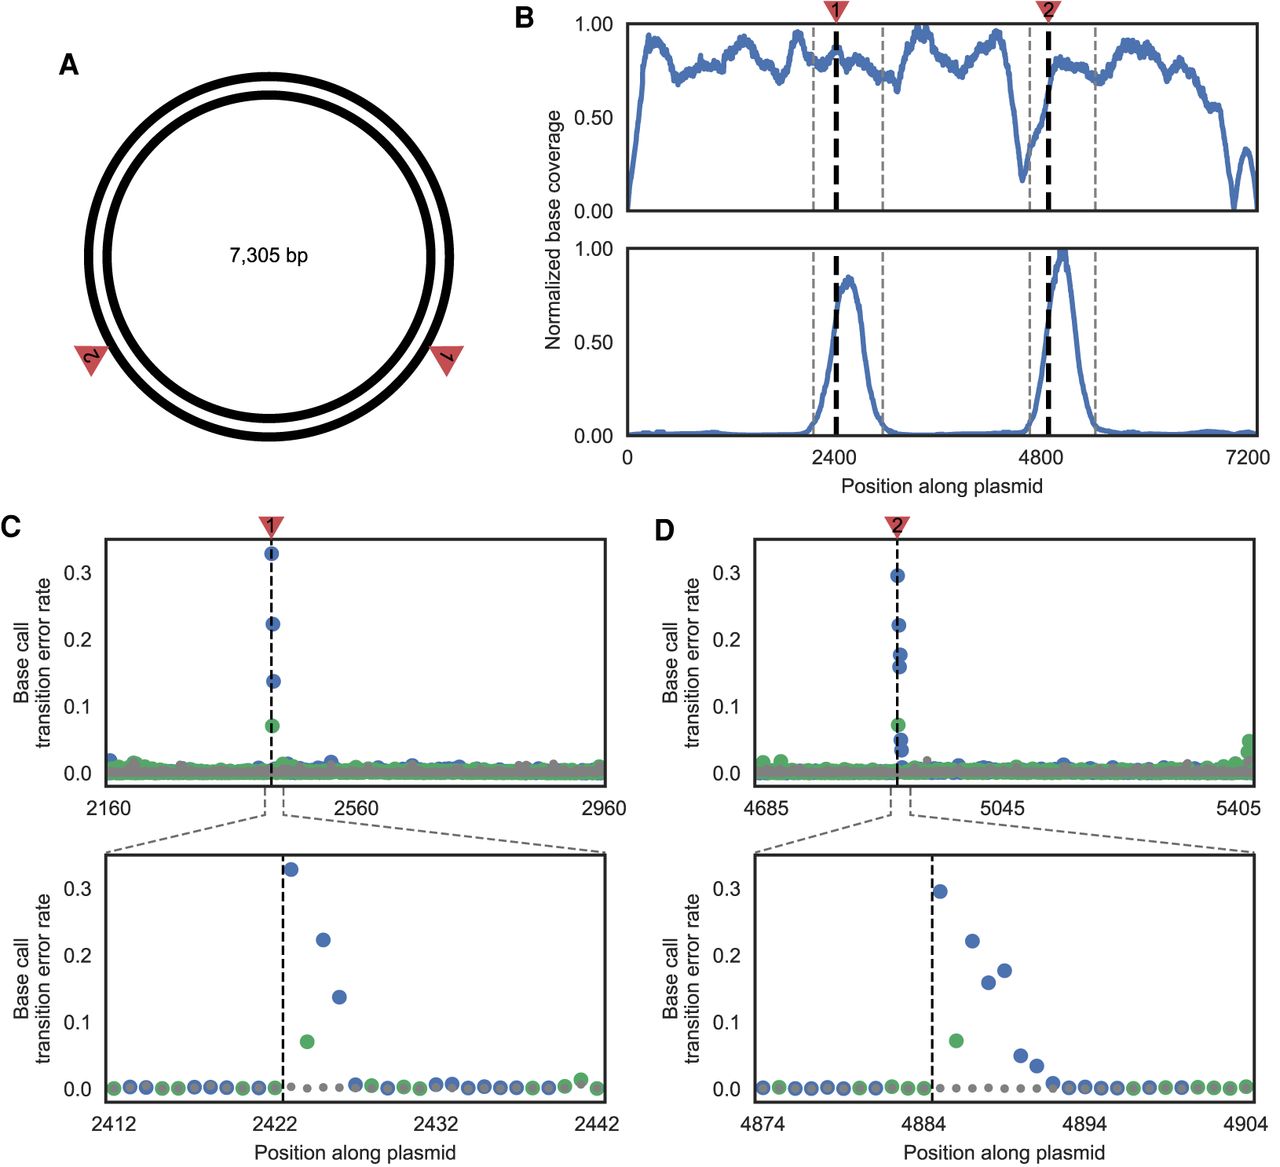
Single-base-pair resolution of nicks in plasmid DNA. (A) Schematic of the plasmid used to test DENT-seq in which red arrows represent the expected locations of nicks after treatment with the nicking endonuclease Nb.BsmI (both are expected on the reference strand). (B) Sequence coverage normalized to the location with maximum read depth for untreated plasmid (top) and plasmid with two nicks introduced by Nb.BsmI treatment (bottom) after performing DENT-seq. Black dashed lines represent the expected locations of nicks after Nb.BsmI treatment and gray dashed lines represent the bounds of MACS2 peaks called on data from the treated sample. (C,D) Mutational signal for all locations within the called MACS2 peaks (top) and close-up views where there is high mutational signal (bottom). Black dashed lines represent the expected locations of nicks after Nb.BsmI treatment. Data in gray represent the untreated plasmid, whereas data in blue and green represent the Nb.BsmI treated sample where a P or K residue would be inserted after a reference strand nick, respectively.


