
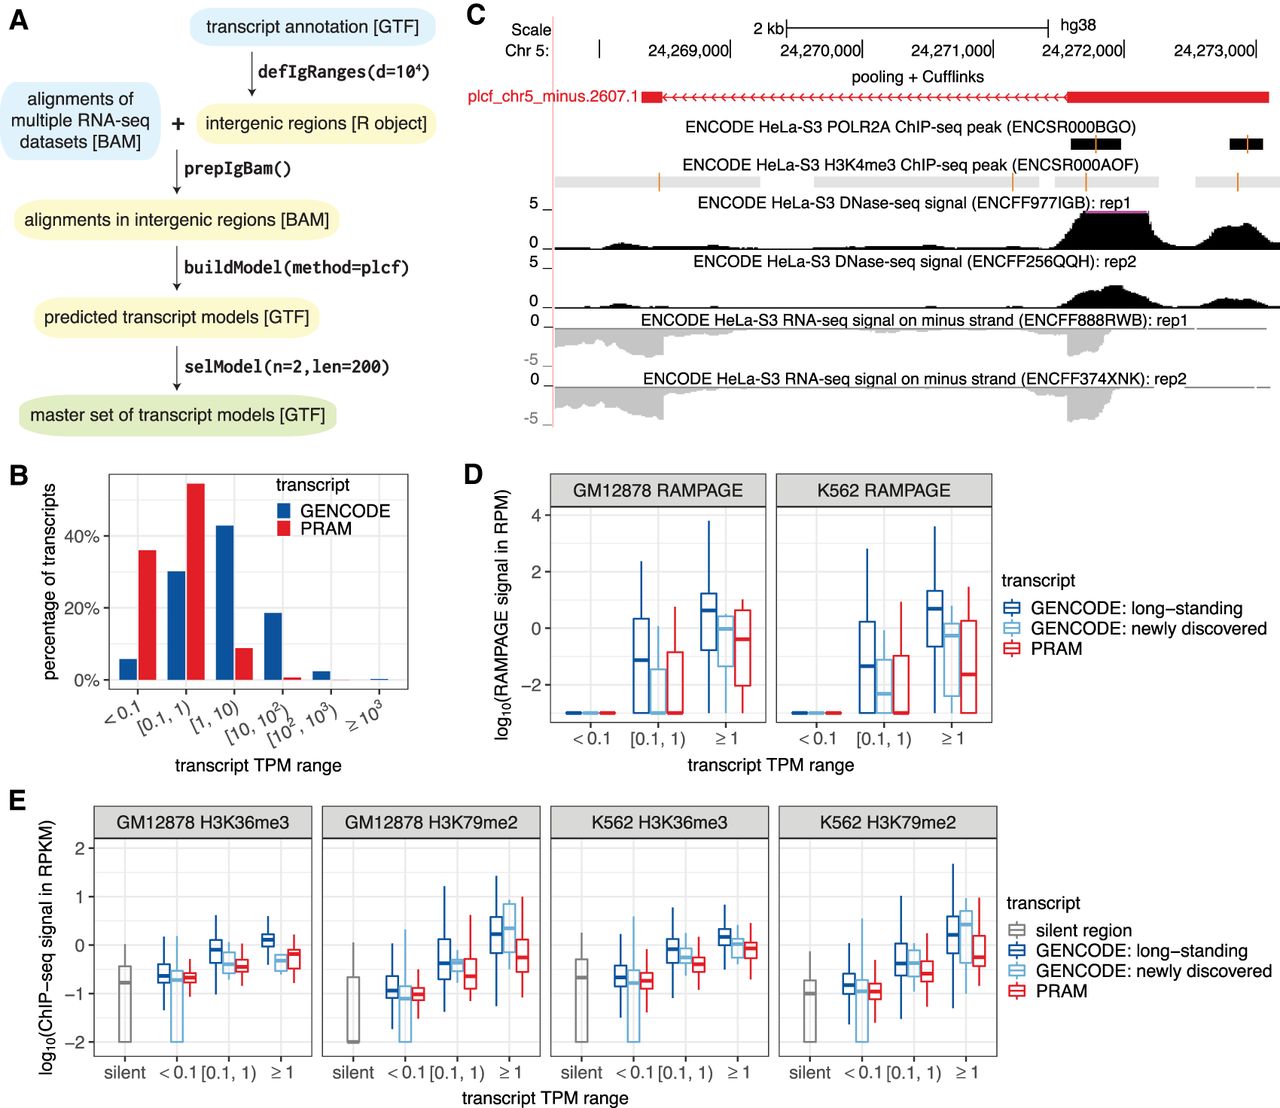
PRAM as a new computational framework predicts a valid master set of transcript models in human intergenic regions. (A) PRAM's workflow of input (cyan), intermediate (yellow), and output (green) files, with format labeled in brackets. PRAM's R functions and example parameters for each step are displayed next to arrows. (B) Distribution of GENCODE and PRAM transcripts in terms of expression levels across seven ENCODE cell lines. (C) PRAM transcript with the highest TPM had multiple complementary genomic features supporting its existence. The model ‘plcf_chr5_minus.2607.1’ had an average TPM of 245 in HeLa-S3 cells. It had high DNase-seq signals around its 5′ exon, suggesting high chromatin accessibility, and had multiple H3K4me3 ChIP-seq peaks, suggesting active transcription. Moreover, it had two RNA Pol II ChIP-seq peaks in close proximity to its transcription start site. All of these external genomic data supported the existence of this highly expressed PRAM transcript. (D,E) RAMPAGE (D) and histone modification ChIP-seq (E) signals of GENCODE and PRAM transcripts stratified by their expression levels together with ‘silent genomic regions’ defined based on H3K27me3 peaks as negative controls in all of GM12878 or K562's data sets. RAMPAGE and ChIP-seq values were derived from replicate 1 in their corresponding data sets (Supplemental Tables 13, 14). Transcripts with promoter or genomic span mappability <0.8 were excluded from D or E, respectively, due to uncertainty in their RAMPAGE or epigenetic signals. RAMPAGE and ChIP-seq signals were calculated as reads per million (RPM) and reads per kilobase per million (RPKM), respectively.


