
Abstract
The human pathogen severe acute respiratory syndrome coronavirus 2 (SARS-CoV-2) is responsible for the major pandemic of the twenty-first century. We analyzed more than 4700 SARS-CoV-2 genomes and associated metadata retrieved from public repositories. SARS-CoV-2 sequences have a high sequence identity (>99.9%), which drops to >96% when compared to bat coronavirus genome. We built a mutation-annotated reference SARS-CoV-2 phylogeny with two main macro-haplogroups, A and B, both of Asian origin, and more than 160 sub-branches representing virus strains of variable geographical origins worldwide, revealing a rather uniform mutation occurrence along branches that could have implications for diagnostics and the design of future vaccines. Identification of the root of SARS-CoV-2 genomes is not without problems, owing to conflicting interpretations derived from either using the bat coronavirus genomes as an outgroup or relying on the sampling chronology of the SARS-CoV-2 genomes and TMRCA estimates; however, the overall scenario favors haplogroup A as the ancestral node. Phylogenetic analysis indicates a TMRCA for SARS-CoV-2 genomes dating to November 12, 2019, thus matching epidemiological records. Sub-haplogroup A2 most likely originated in Europe from an Asian ancestor and gave rise to subclade A2a, which represents the major non-Asian outbreak, especially in Africa and Europe. Multiple founder effect episodes, most likely associated with super-spreader hosts, might explain COVID-19 pandemic to a large extent.
The human severe acute respiratory syndrome coronavirus 2 (SARS-CoV-2) was first detected in late 2019 in patients from the city of Wuhan (Hubei province, China) suffering from respiratory illnesses and leading to a disease that has been popularized as coronavirus disease or COVID-19. The disease was declared an International Public Health Emergency on January 30, 2020, and a few weeks later, on March 11, 2020, it was declared a pandemic by the World Health Organization (WHO 2020). Even though it has not been possible to trace an index case, there is a large amount of epidemiological information that has been very useful for tracking the pandemic spread of SARS-CoV-2. The first report of COVID-19 took place on December 1, 2019, in a patient from Wuhan, most likely linked to the city's Huanan Seafood Wholesale market. Some public reports indicated that the first COVID-19 patients could date back to mid-November 2019. The number of cases grew gradually during December, and most of them were related to the aforementioned seafood market. In mid-January 2020, a number of patients appeared in other provinces of China, probably fostered by the large annual human migration associated to the Spring Festival travel season (starting in mid-December and lasting for about 40 days). Soon COVID-19 spread to other Asian countries (South Korea, February 20, 2020), and beyond: Middle East (Iran; February 19, 2020), the United States (February 20, 2020), Europe (Italy and Spain, January 31, 2020), and so forth.
Wu et al. (2020) reported the first genome sequence of SARS-CoV-2 (29,903 bp length) from a worker at the Wuhan market admitted to the Central Hospital of Wuhan on December 26, 2019; this patient experienced severe respiratory syndrome. The investigators identified a new RNA virus strain belonging to the family Coronaviridae that was subsequently designated as “WH-Hum 1 coronavirus” (and also “2019-nCoV”). According to Coutard et al. (2020), the nearest bat precursor would be RaTG13 with a genome identity to SARS-CoV-2 of 98%. Phylogenetic studies supported the theory of a natural origin for SARS-CoV-2 (Andersen et al. 2020).
Since the beginning of the COVID-19 pandemic, there has been a growing interest in exploring SARS-CoV-2 genetic variation to help to understand the origin and spread of the pandemic and to facilitate the development of future vaccines and diagnostics. The amount of genome data deposited in public repositories in such a reduced time frame offers a unique opportunity to carry out a detailed phylogenetical characterization of SARS-CoV-2 genomes, as well as a geographic mapping of the different clades spreading worldwide, and to study impact of the outbreaks on the genome variability of the virus. Initial analyses so far used a limited number of SARS-CoV-2 genomes and focused mostly on various evolutionary aspects of the coronavirus genomes (Andersen et al. 2020; Forster et al. 2020; Li et al. 2020; Shen et al. 2020). The Global Initiative on Sharing Avian Influenza Data (GISAID) (Shu and McCauley 2017) provides public access to the most complete collection of genetic sequences of several viruses, with special emphasis on influenza viruses. In 2020, GISAID started to compile sequence data from the virus causing COVID-19, and now it makes thousands of genomic sequences of the virus available. The China National Center for Bioinformation keeps an updated resource on COVID-19 (https://bigd.big.ac.cn/ncov/tool/annotation?lang=en) (Zhao et al. 2020) and provides different analytical tools to study SARS-CoV-2 variation. The open-source project Nextstrain (https://nextstrain.org) (Hadfield et al. 2018) provides an interactive web portal that allows navigating SARS-CoV-2 genome variation and helps tracking the spread of disease outbreaks.
In the present study, we built a solid phylogenetic skeleton of SARS-CoV-2 genomes that allows us to investigate sequence variation in a large number of genomes (more than 4700) deposited in GISAID, explore site-specific mutational instability, investigate different scenarios for the root of SARS-CoV-2 genomes, analyze phylogeographic patterns of variation worldwide, and investigate transmission patterns of the disease, for example, the impact of homogeneous versus super-spreader transmissions in the pandemic.
Results
Identity of SARS-CoV-2 to other closely related species
Human SARS-CoV-2 genomes have a within sequence identity of 99.98% (Table 1) and are much more identical to bat coronaviruses than to pangolin coronaviruses, although the values vary substantially depending on the specimen (93.44%–96.17%) (Table 1). When compared to pangolin coronaviruses, the range of genome identities drops to 85.24%–92.35%.
Interspecific comparisons of sequence identities between different coronaviruses, including those from pangolin (Manis javanica) and bat (Rhinolophus affinis) against the whole HQ SARS-CoV-2 data set (3478 genomes)
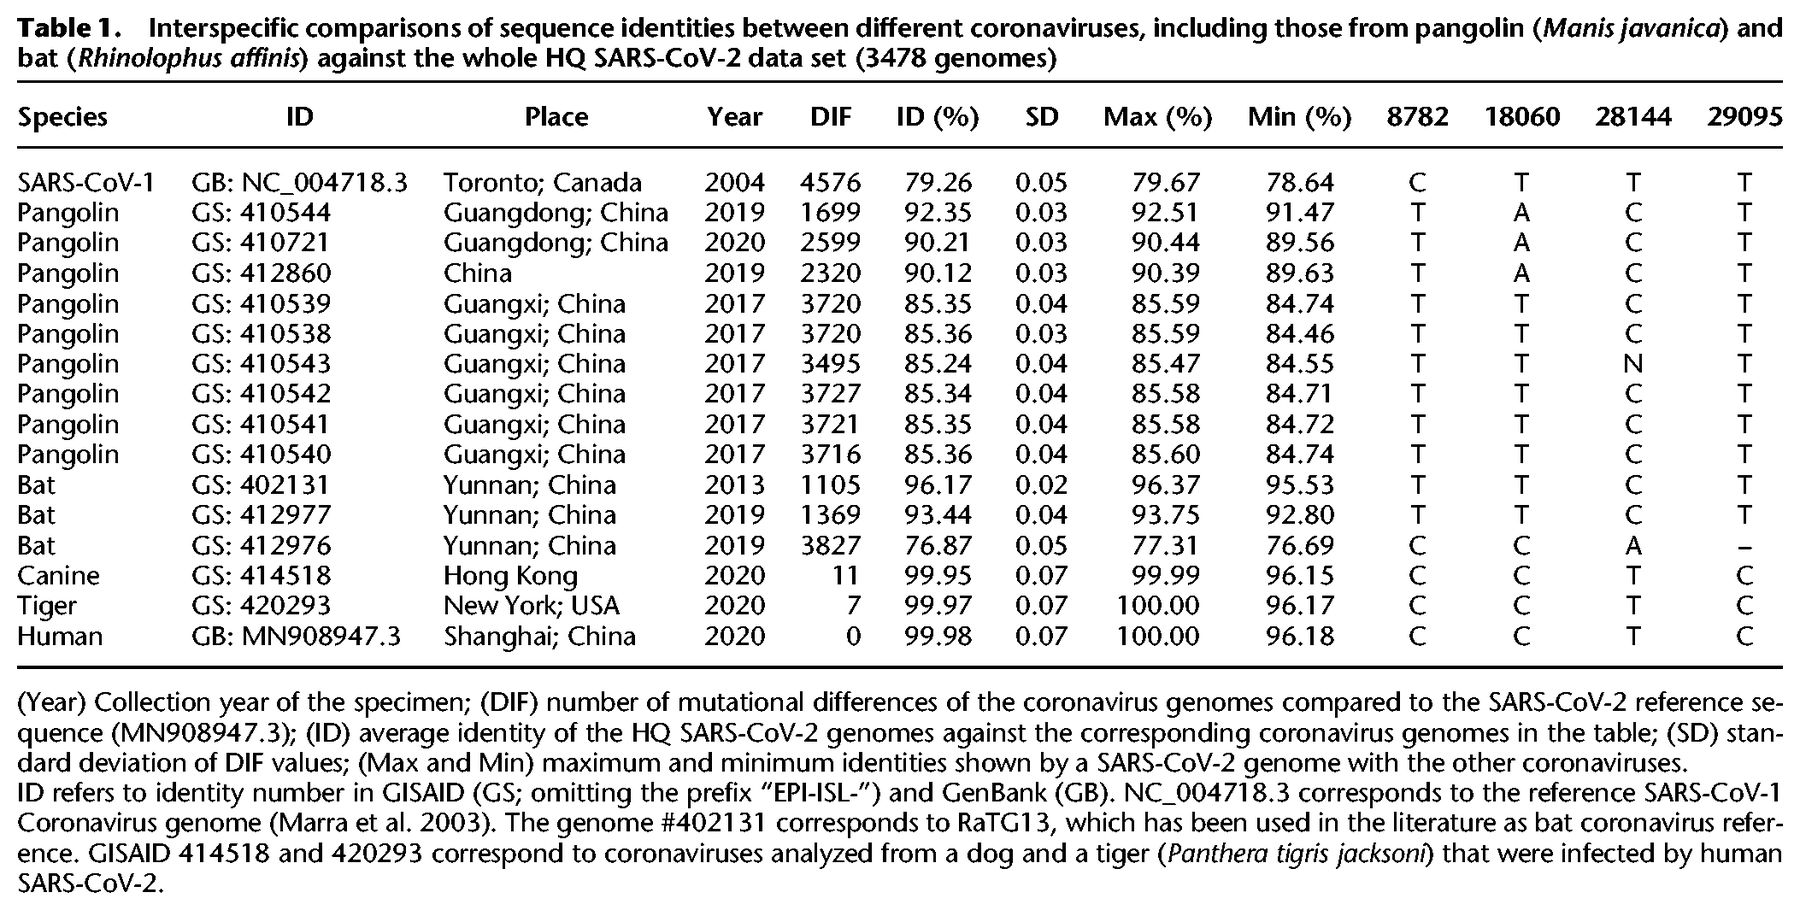
Between 1699 and 3727 substitution variants separate the pangolin coronavirus genomes from the SARS-CoV-2 reference sequence, and this range drops to 1105–1369 (Table 1) when compared to bat coronavirus genomes. The bat #412976 is problematic because it has an unusual number of mutational differences with respect to the SARS-CoV-2 reference and has an abnormal low sequence identity with human coronaviruses (76.87%), comparable to pangolin coronaviruses. Therefore, this genome complicates sequence alignment and should be avoided in future comparative analyses.
Interspecific phylogeny and problematic inference of the root of SARS-CoV-2
An interspecific maximum likelihood (ML) tree was built using pangolin, SARS-CoV-1, and bat coronavirus genomes as outgroups to investigate their phylogenetic relationships with SARS-CoV-2 (Supplemental Fig. S1). The tree depicts the SARS-CoV-1 genome in the most external branch. Next, all the pangolin genomes cluster separately from bat and human coronaviruses, which also group separately. In line with its very low identity with SARS-CoV-2, bat #412976 behaves as an outlier in the tree. Overall, the clustering pattern in the phylogeny is in very good agreement with sequence identity values (Table 1).
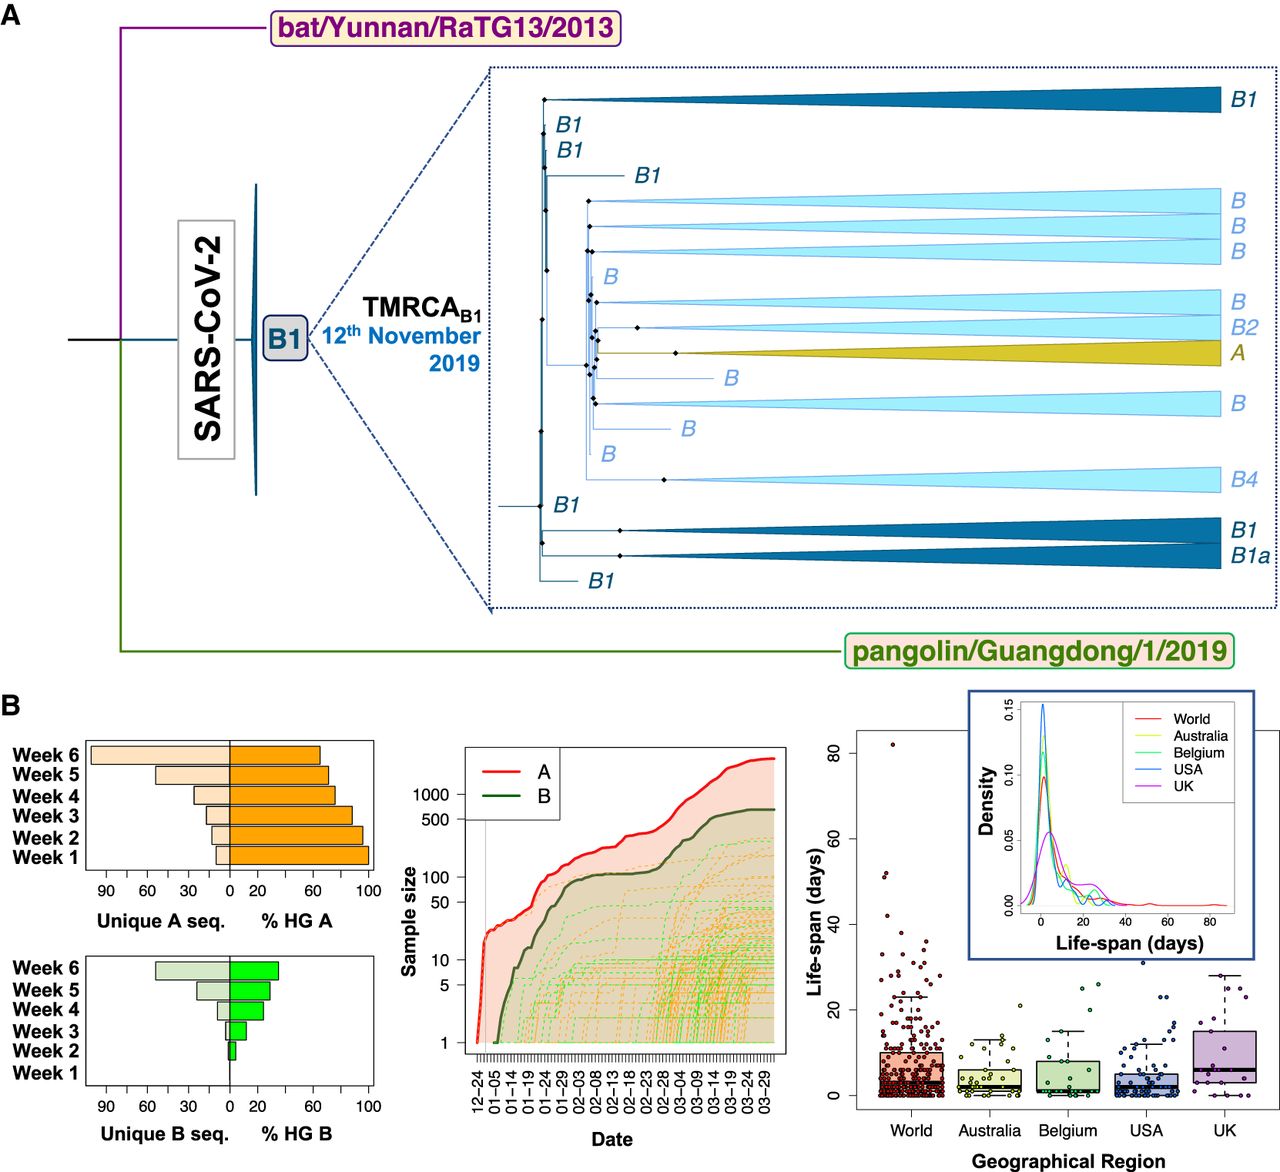
We next focused our attention on the root for all existing SARS-CoV-2 genomes, assuming the most related bat and pangolin coronavirus genomes as the closest coronavirus relatives. We built a new ML tree including most related bat and pangolin coronavirus sequences as outgroups and all SARS-CoV-2 genomes sequenced up to February 29, 2020 (n = 621); almost all of them are of Asian origin and this group of sequences should contain the most recent common ancestor (MRCA), because it is evident from phylogenetics and epidemiology that the origin of the pandemic is in China (see below and Supplemental Material). The ML tree reveals that the root of SARS-CoV-2 is located in B1 (Fig. 1A). In agreement with the ML tree, the bat genomes share the variants that characterize haplogroup B1 and separate them from A (C8782T, C18060T, and T28144C) (Table 1). However, if we restrict the analysis to genomes appearing before mid-January, we observe that the root of SARS-CoV-2 appears in haplogroup B2 (this is because B1 genomes disappear from the data set) (Supplemental Fig. S2). The bat genome share also the diagnostic variant that leads from B to B2 (C29095T) (Table 1). In agreement with this observation, the network provided by Forster et al. (2020) (their Fig. 5) indicates that the root of SARS-CoV-2 is located in a reticulation that we could identify as being representative of either haplogroups B1 or B2.
Contrasting evidence supporting different roots for SARS-CoV-2 genomes. (A) Interspecific ML tree using genomes sampled in GISAID before March 2020, indicating the root in haplogroup B1 for all existing SARS-CoV-2 genomes. (B, left) The histograms on the right represent the number of unique haplotypes belonging to haplogroups A and B accumulated during the first 6 wk of the pandemic, whereas the histograms on the left show the evolution of the frequencies of haplogroups A and B in the same period (note that A and B frequencies are complementary); (middle) growth of sample size of the main A branch (red solid line) and A sub-branches (red dashed lines) and the main B branch (green solid line) and B sub-branches (green dashed lines), indicating that B and derivative clades appear at a later moment of the pandemic than A and its subclades. The gray vertical line separates year 2019 from year 2020; (right) boxplot and density function of the life-span period of identical haplotypes in the database (as a proxy for the life-span period of a SARS-CoV-2 genome) worldwide and in various countries (by way of example, we only included those data sets having high sample sizes).
SARS-CoV-2 weighted mean substitution rate, as inferred from the ML tree, is 5.42 × 10⁻⁴ substitutions per site per year (s/s/y) (Bootstrap 2.5%–97.5% CI: 4.29 × 10⁻⁴ to 8.02 × 10⁻⁴ s/s/y) according to an uncorrelated relaxed-clock method; a slightly higher mutation rate of 6.05 × 10⁻⁴ s/s/y (Bootstrap 2.5%–97.5% CI: 4.46 × 10⁻⁴ to 8.22 × 10⁻⁴ s/s/y) was obtained assuming a strict-clock model. According to a relaxed-clock model mutation rate, the time of the most recent common ancestor (TMRCA) for all SARS-CoV-2 genomes dates to November 12, 2019 (Bootstrap 2.5%–97.5% CI: August 7, 2019 to December 8, 2019), fully matching epidemiological dates (considering an incubation period of about 2 wk before the first COVID-19 case reported on December 1, 2019) (Huang et al. 2020); estimates using a strict-clock mutation rate varied very little: November 7, 2019 (Bootstrap 2.5%–97.5% CI: August 18, 2019 to December 2, 2019).
Inference of the root based on ML and using an outgroup appears however to be in full conflict with the chronology of the SARS-CoV-2 genomes and the evolutionary pattern suggested by this chronology in its initial Asian outbreak. The first genomes sequenced were sampled from initial COVID-19 cases in Hubei, China. Thereby, the first genome (December 24, 2019) corresponds to a member of haplogroup A, whereas the first B genome (a basal B haplotypes) appears nearly 2 wk later (January 5, 2020), when A had already accumulated 23 genomes in the database and substantial genome variability (Fig. 1B). Haplogroup B increased its frequency progressively in the next few weeks after its first appearance in the database, and new subclades of A and B appeared almost at the same time around both main branches (Fig. 1B). Although B2 emerged in the database on January 10, 2020 in the Chinese province of Guangdong (quite far away from Hubei), B1 emerged even later in Hubei, on January 19, almost at the same time as A3 (nearly a month after haplogroup A) and about a week before A2 (February 28). Taking all this timing scheme into account and considering a TMRCA of SARS-CoV-2 genomes of November 12, the most logical progression of the evolutionary events would be A > B > B1. The inverted progression B1 > B > A (as suggested by ML analysis) would be very difficult to reconcile with the chronology of the genomes if we take into account the following three considerations: (1) the average life span of a SARS-CoV-2 genome worldwide (estimated by looking at the chronology of identical haplotypes) is about 7 d, with a maximum (barring exceptional values) of about 23 d (median = 3.0; whisker upper limit = 23.5; these values are very homogeneous when estimated from different representative countries) (Fig. 1B); (2) the virus mutates slightly faster than 1 or 2 mutations every month (Kupferschmidt 2020); and (3) there are three mutational steps separating A from B1. Therefore, a scenario for B1 to be in the root, bearing in mind the incubation period and that the first member of A appeared on December 24, 2019, would require that B1 existed from the very beginning (∼November 12), that is, about >60 d before A. If that was the case, it is difficult to explain (1) why B1 remained unsampled for >3 mo until the end of January, and (2) the unusually long life span for the B1 lineage (∼3 mo for the basal B1 haplotype) (Fig. 2A,B).
Scheme explaining two alternative models for the location of the root of the SARS-CoV-2 genomes according to their chronologies. (A) Locating the root in haplogroup A would be consistent with a logical evolutionary time line that accounts for the number of mutations accumulated from an alleged pre-A ancestor originating from a zoonotic transmission between an intermediary animal and humans (occurring ∼November 12, 2019) and also consistent with TMRCA values estimated for Chinese A, B, B1, and B2 haplotypes (see text). The alternative of considering B1 as the root would enter into conflict (represented by a question mark) with mutation rates of SARS-CoV-2 genomes, coupled with the large unsampled period needed to explain the hypothetical first appearance of B1 on approximately November 12, 2019 and its first sampling on January 19, 2020, as well as TMRCA for haplogroups A, B, B1, and B2 (see text). (B) The scheme summarizes the two alternative evolutionary scenarios assuming roots in haplogroup A or B1, according to the time lines outlined in the upper panel.
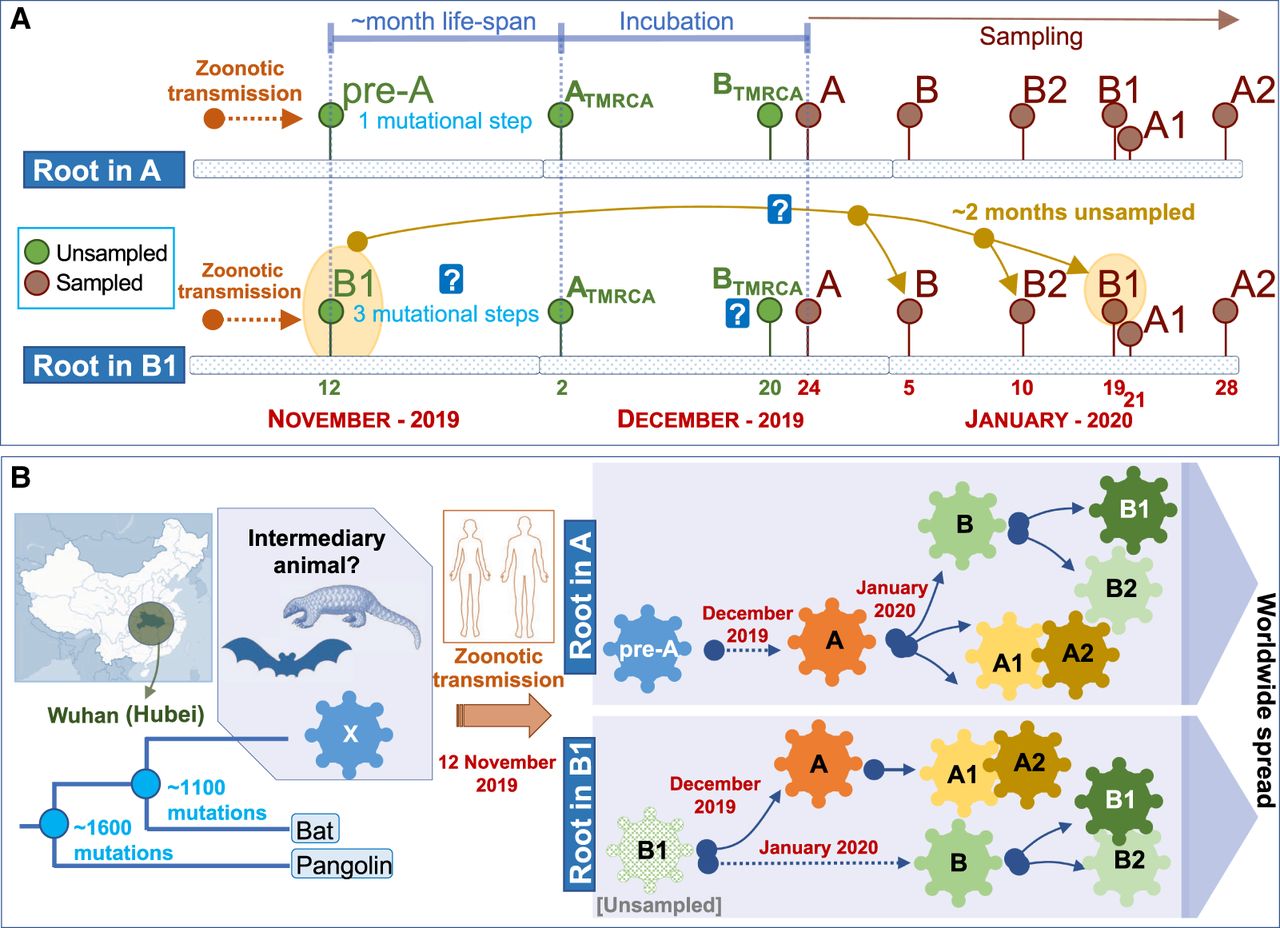
With the aim of further exploring the root of all present-day SARS-CoV-2 genomes, we computed the TMRCA for both lineages using A and B haplotypes sampled in China until the end of February. TMRCA for haplogroup A (n = 176) is December 2, 2019 (Bootstrap 2.5%–97.5% CI: October 7, 2019, to December 12, 2019), whereas for haplogroup B (n = 92) it is >2 wk more recent, namely, December 20, 2019 (Bootstrap 2.5%–97.5% CI: October 10, 2019, to December 29, 2019). Although with lower sample sizes (and therefore very large CI), we also obtained consistently more recent TMRCAs for B1 (n = 6; 23 December 2019; Bootstrap 2.5%–97.5% CI: May 24, 2019, to January 18, 2020) and B2 (n = 13; January 3, 2020; Bootstrap 2.5%–97.5% CI: August 18, 2019, to January 9, 2020). The more recent TMRCAs for B, B1, and B2 than for A are consistent with the fact that the B, B1, and B2 haplotypes sampled on January 4, 10, and 22, 2020, correspond to the basal nodes (they carry only the mutations that characterize their sequence motifs), with no variation accumulated that could indicate an older age for these haplogroups.
Intraspecific phylogeny and phylogeographic patterns of SARS-CoV-2
The most parsimonious tree (Fig. 3) shows that, in agreement with previous investigators (including Nextstrain) (Tang et al. 2020), the two very stable transitions C8782T and T28144C (3 and 1 total occurrences in the global phylogeny, respectively) separate SARS-CoV-2 variation into two main clades, A and B, both originating in China. In addition to these well-known main nodes, we identified 164 haplogroups (Fig. 3; for mutational pathways to phylogenetic branches, see Supplemental Table S2). The structure of the branches in the parsimonious tree fully agrees with the skeleton shown in the ML tree (Supplemental Material; Supplemental Fig. S3) and the MDS analysis that clusters genomes according to diagnostic variants (Supplemental Fig. S4).
Maximum parsimony tree of SARS-CoV-2 genomes. Small histograms represent relative frequencies of the given haplogroup or sub-haplogroup in the different regions. Mutations along branches are referred to changes against the reference sequence. Mutations in dark green indicate parallel events along the different branches of the phylogeny. Mutations with an @ symbol indicate reversions.
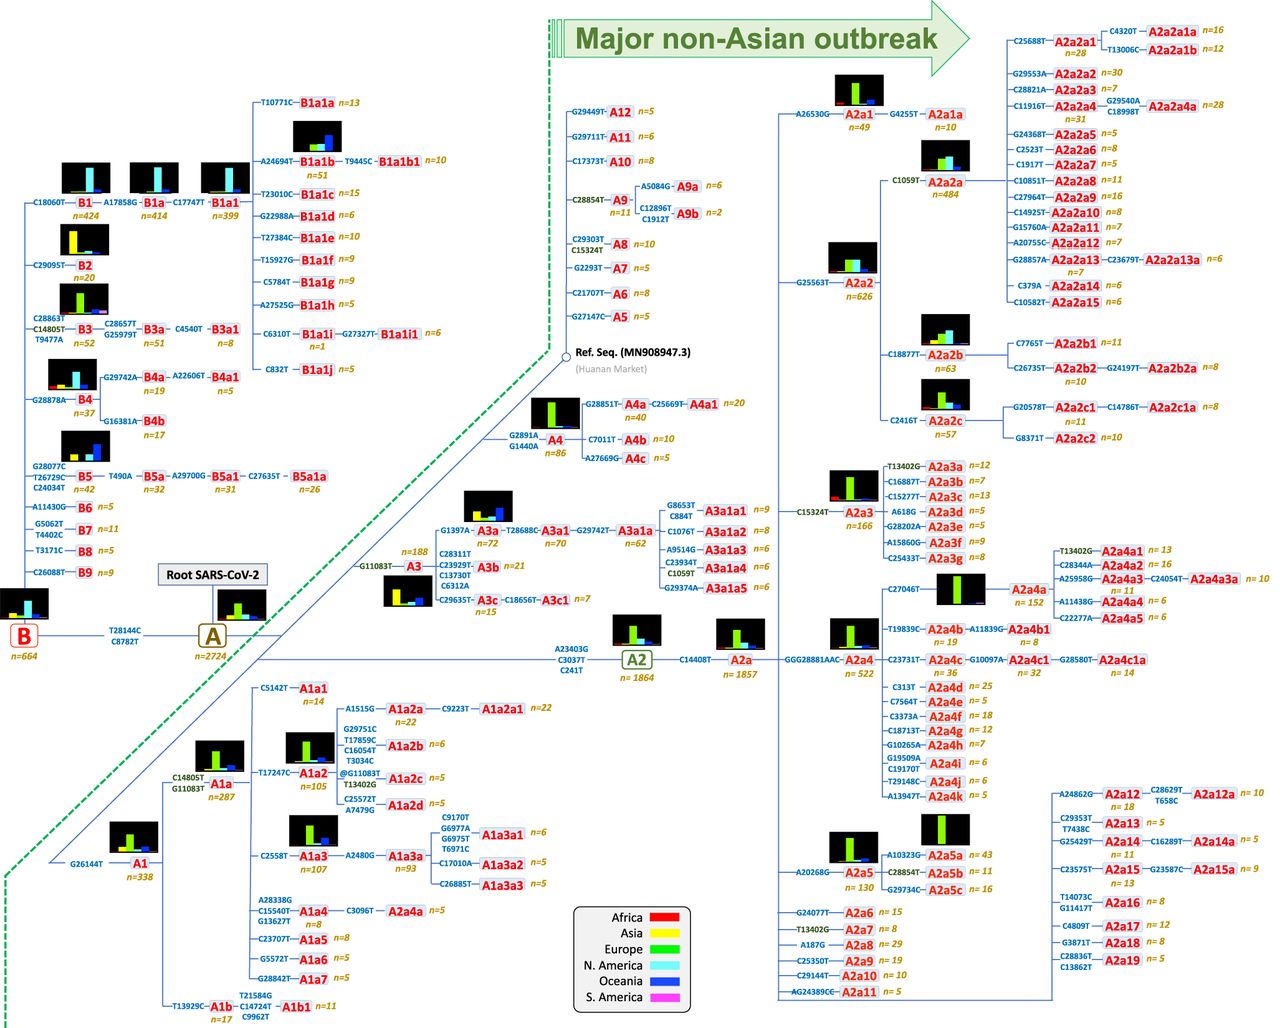
Sub-haplogroups emerging from these main clades are mainly supported by single mutations, most of them being mutationally very solid along the phylogeny (Supplemental Material; Supplemental Table S1; Supplemental Fig. S5), therefore granting the robustness of the different clades. Mutations distribute along the whole extension of the coronavirus genome in a rather uniform way (Supplemental Fig. S6).
Supplemental Figure S7 describes the accumulation of genomes in GISAID partitioned by main haplogroups, indicating the importance of A and sublineages of A in the pandemic (see below); whereas Supplemental Figure S8 shows the frequency of these main lineages per continental region and also diversity values, showing substantially heterogeneous patterns worldwide (Supplemental Table S3).
Phylogeographic information allows reconstructing dynamics of (sub)haplogroups worldwide (Fig. 4). The two main clades (A and B) and most of their main first step–derived subclades (e.g., A1, A3, B1, B2) originated in Asia (mostly in China), but numerous subclades (some of them reaching locally high frequencies) most likely appeared outside Asia; most of these subclades emerged by the occurrence of domestic mutations that accumulated on top of Asian and non-Asian ancestor clades (next section; Supplemental Material).
Map showing the worldwide spread of the main SARS-CoV-2 clades. Circle areas are proportional to frequencies (e.g., A2a is contained within A, and so on), and the arrows indicate just an approximate reconstruction of the phylodynamics of SARS-CoV-2 from the beginning of the Asian outbreak to the non-Asian spread of the pathogen based on the phylogeny, genome chronology (as recorded in the metadata that indicates the sampling origin and dates), and genome variation. Classification of genomes into haplogroups is according to the phylogeny shown in Figure 3. Minor subclades are indicated in rectangular shapes with their corresponding labels. In addition, other minor haplogroups involved in the SARS-CoV-2 spread (in brackets are the number of subclades involved) are indicated below continental labels.
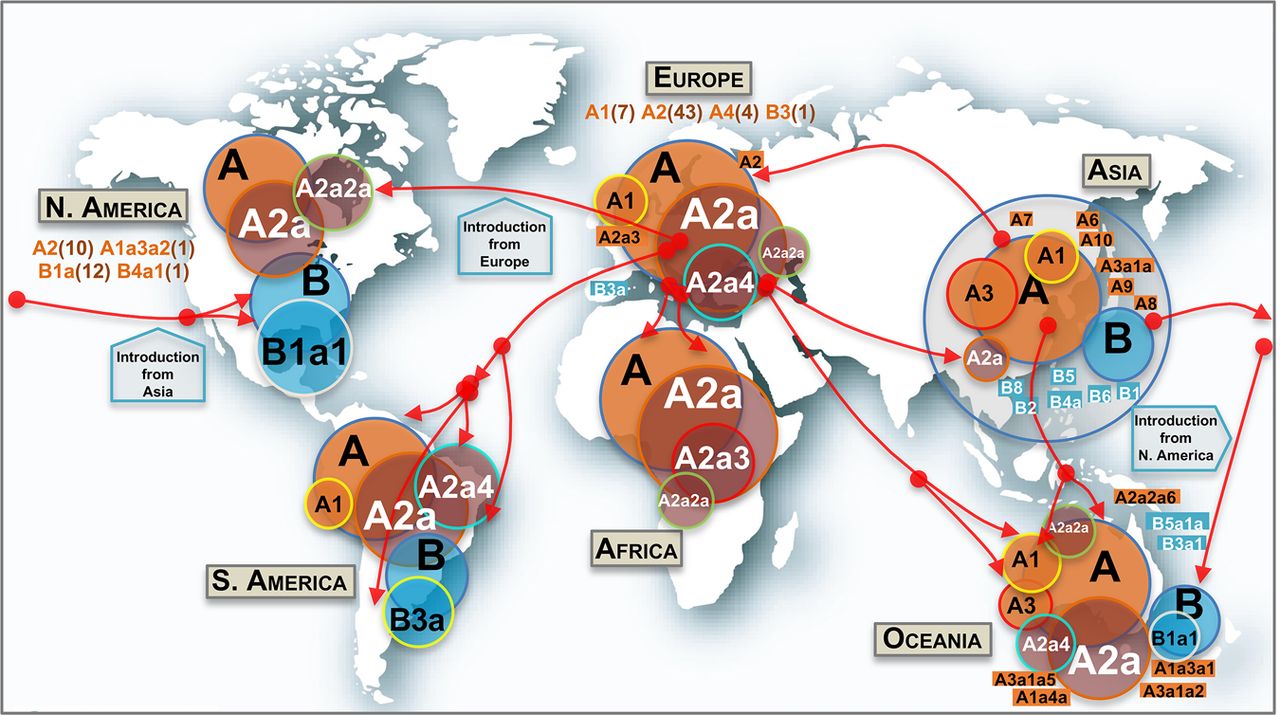
Haplogroup A, with complementary frequencies to B, is the predominant clade across the world (n = 2715, 80% of all the high-quality [HQ] database) (Fig. 4), although with patterned distributions geographically (see frequency interpolated maps in Supplemental Fig. S9). The core haplotype of A is the reference SARS-CoV-2 genome for nomenclature, and it is the most frequent one within paraphyletic A (A*) and one of the most frequent within the whole haplogroup A; this haplotype was almost exclusively sampled in Asia (56 of 70 genomes in the database). Haplogroup A reaches its highest frequencies in Europe (97%) and Africa (93%), but it is also very frequent in Asia and Oceania (77% in both continents), whereas it has the lowest frequencies in South America (68%) and North America (53%). A2 is, by far, the most frequent subclade of haplogroup A worldwide, and the vast majority of the available A2 genomes belong to its subclade A2a (n = 1814; 68% of all A genomes; substitutions C241T–C3037T–A23403G from A to A2, and C14408T from A2 to A2a), this subclade is the main representative of the non-Asian outbreak, followed by A1a (n = 287; 11%) (Supplemental Fig. S9). According to the genome chronology, the first A2 genome available in Europe corresponds to a Bavarian (German) patient (GISAID: #406862) and was sampled on January 28, 2020; this genome contains no mutational differences with respect to the root of A2 (Fig. 3). The next A2 genome sequence was sampled in a Chinese patient from Shanghai (GISAID: #416334) on February 6, 2020, but this Asian genome differs by two substitutions with respect to the root, suggesting that is a derived genome imported to China from Europe. The next A2 genomes appeared in the Belgium and US data sets. The chronology of genomes supports therefore a European origin for A2 (Fig. 4). In agreement, the first two A2a genomes appear in Europe too. In particular, these two genomes occur in one of the main initial foci for the European outbreak, namely Lombardy in Italy, on February 20 and 24, 2020; soon after, two other A2a representatives appeared in Madrid and Castilla-Leon (Spain) on February 24 and 25, 2020, respectively. A2a is mostly present in Europe (n = 1184; 77% of all genomes in Europe and 65% of all A2a sequences worldwide), and it probably originated from a European A2 genome (most likely from Italy) (Fig. 4). In agreement with a non-Asian origin of A2a, the database registers the first East Asian basal A2a genomes on March 11, 2020. Therefore, phylogeographic inferences point to a European origin for both A2 and its highly successful subclade A2a. Haplogroup A3 is the most common A sub-haplogroup in Asia (24% of its genomes), and it most likely originated there, in particular in China, where it appears from January 18, 2020 (Supplemental Fig. S9). Different subclades of A2a spread most successfully in some continents, for example, A2a4 (with the diagnostic MNP GGG28881AAG on top of A2a motif) in South America (41% of all A sequences vs. 0% A2a2a) and A2a2a (substitution C1059T on top of A2a2) in North America (61% of all A sequences vs. 8% of A2a2a), but both subclades probably originated in Europe (A2a2a most likely in France). A2a4 is one of the most widespread subclades; it reaches the highest European frequency in Switzerland (53% of all lineages in this country) and the Netherlands (51%); the first genome in the database was sampled in Italy on February 25, 2020. Other minor clades were detected in very restricted geographic areas; for instance, A4a is exclusively found in Wales (United Kingdom) (39 of 76 [51%] genomes in this region) (Supplemental Fig. S9), whereas, for example, minor clades A5, A7, and A9b appear only in the Asian data set.
Haplogroup B (n = 652; 20% of the genomes in the database) is present in all continents, with higher prevalence in North America (47%), South America (32%), and Asia and Oceania (23%) (Supplemental Fig. S9). Haplogroup B1, separated from B by a single transition (C18060T), is by far the largest B subclade (n = 424; 64% of all B). The main proportion of B1 lineages worldwide is in the subclade B1a1 (A17858G and C17747T substitutions on top of B1), which shows the highest frequency in North America (n = 357; 42% of all the genomes in the region and 55% of all existing B genomes worldwide) (Supplemental Fig. S9). B1a1 splits into 10 minor subclades (from B1a1a to B1a1j) (Fig. 3), each defined by characteristic single mutations; most of them (if not all) probably originated in North America.
Asia is the only region containing genomes belonging to all first level and minor B-subclades (B1, B2, B3, etc; perhaps with the exception of the minor clade B9 which could have originated in Spain). The first three basal B1 haplotypes appeared in China on February 19 and 21, and the next one in the United States on February 25; then a few more appeared only in China and other Asian locations. The overall chronology and its phylogenetic features therefore suggest China as the most likely origin for B1. There are several subclades within the B phylogeny that originated in non-Asian regions. For instance, in Europe, the main B subclade is B3a (70% of all B haplotypes in Europe; B > B3: diagnostic variants T9477A–C14805T–C28863T, and B3 > B3a: substitutions G25979T–C28657T), which emerged at the end of February 2020 in Europe (as did its immediate ancestor B3), and it is particularly prevalent in Spain, one of the main European epicenters of COVID-19 (Supplemental Fig. S9). It is most likely that most of these B3a representatives arrived in South America (where it represents 71% of all the B genomes) from Spain given the high connectivity between the two regions (Fig. 4). Moreover, the high B3 frequency observed in Spain marks a notable difference with respect to other European countries: 32 of the 37 (86%) B3 genomes in Europe are found in Spain. Conversely, B4a1 probably originated in North America in March 2020, evolving from an Asian B4a (B > B4: variant G28878A; B4 > B4a: variant G29742A, and B4a > B4a1: transversion A22606T).
The number of sequences belonging to clade A and its main subclades increased exponentially during the outbreak occurring outside Asia at the end of February 2020, while the frequency of haplogroup B genomes increased more slowly during that time (Supplemental Material; Supplemental Fig. S10). Nucleotide diversity is almost homogeneous across all the different geographical regions for the main haplogroups; however, haplotype diversity (HD) values vary more substantially among haplogroups, probably indicating the weight of sequence founders in this statistical index (see next section on super-spreaders) (Supplemental Material).
Super-spreaders and founder effects
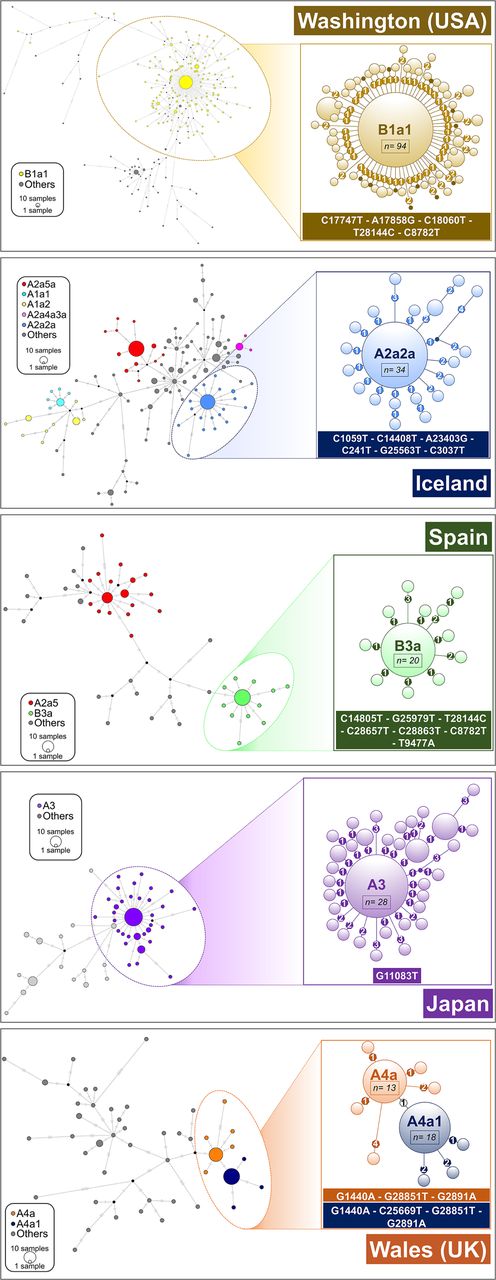
A few haplotypes are disproportionally represented in specific continental regions or countries (Supplemental Material; Supplemental Fig. S11), appearing abruptly in a period of a few days. This pattern might be compatible with super-spreaders acting on certain geographic locations and giving rise to severe founder effects. Haplotypes H1, H2, H3, and H4 (IDs as in Supplemental Table S4) are the most frequently repeated ones. Haplotype H1 (n = 133; root haplotype of A2a2a: C1059T–C14408T–A23403G–C241T–G25563T–C3037T) occurs in Europe at high frequency (75/133; 56%) and in North America (48/133 [36%]; mostly in the United States with 45 occurrences); the first instances appeared in France on February 21 and 28, 2020. H2 (n = 132; root haplotype of B1a1: C17747T–A17858G–C18060T–T28144C–C8782T) appears at high frequency and almost exclusively in the United States (126/132; 95%); the initial instances emerged in the United States from February 20, 2020, onward. H3 (n = 94; the root haplotype of A2a4: C14408T–A23403G–C241T–GGG28881AAC–C3037T) reaches very high frequency in the United Kingdom (26/94; 28%) and Australia (11/94; 12%); this haplotype is the most widespread one in the global database (being present in 16 countries across all continents). Haplotype H4 (n = 78; haplogroup A) corresponds to the reference sequence (GenBank accession number MN908947.3) and it reaches the highest frequency in Asia (61/78; 78%), particularly in China (53/78; 68%); the frequency of H4 increased in two pulses, one coinciding with its first appearance in China at the end of December 2019, and the next coinciding with the large Asian outbreak in mid-February 2020; later, H4 moved to other non-Asian locations, for example, the United States (11/78; 14%). Several other highly frequent haplotypes emerged during the pandemic worldwide, many of them deriving from clade A2a (e.g., H6 [n = 55; haplogroup A2a4a; first instance in Italy]; H7 [n = 38; haplogroup A2a3; first instances in France and Switzerland]) (Supplemental Table S4).
There are additional examples of SARS-CoV-2 high-frequency haplotypes (Supplemental Table S4) appearing in very restricted geographic areas. For instance, H9 (n = 33; haplogroup A3) appears at high frequency in Japan (28/33; 85%, and 29% of all genomes in Japan). In Iceland, founder haplotypes represent a large proportion of all existing haplotypes on the island, for example, H8 (haplogroup A2a5a) exists only in Iceland (n = 37; 14% of all genomes in Iceland), and together with H1 (n = 15 in Iceland) and other three haplotypes, sum up 53% of all the haplotypes in this country (77 of the total 144; 53%). In the United States, H1 occurs 45 times, and H2 126 times; together with six other haplotypes, they make up 32% of all genomes in this country (241 of the total 756). In the United Kingdom, haplotype H3, together with eight other haplotypes, make up 28% of the total haplotypes (112 of the total 393). H10 (n = 26; B3a) and H15 (n = 22; A2a5) are among the main haplotypes responsible for the initial Spanish outbreak; H10 (21/26 in Spain; 81%) is particularly interesting because it belongs to haplogroup B3a, whereas almost all European haplotypes belong to haplogroup A (Supplemental Material).
Common haplotypes are frequently shared between neighboring countries, an observation mirroring the easy spread of the virus over short geographic distances: for instance, H33 (n = 9; of which seven are in Portugal and two in Spain) or H46 (n = 7; of which four are in Portugal and one in Spain).
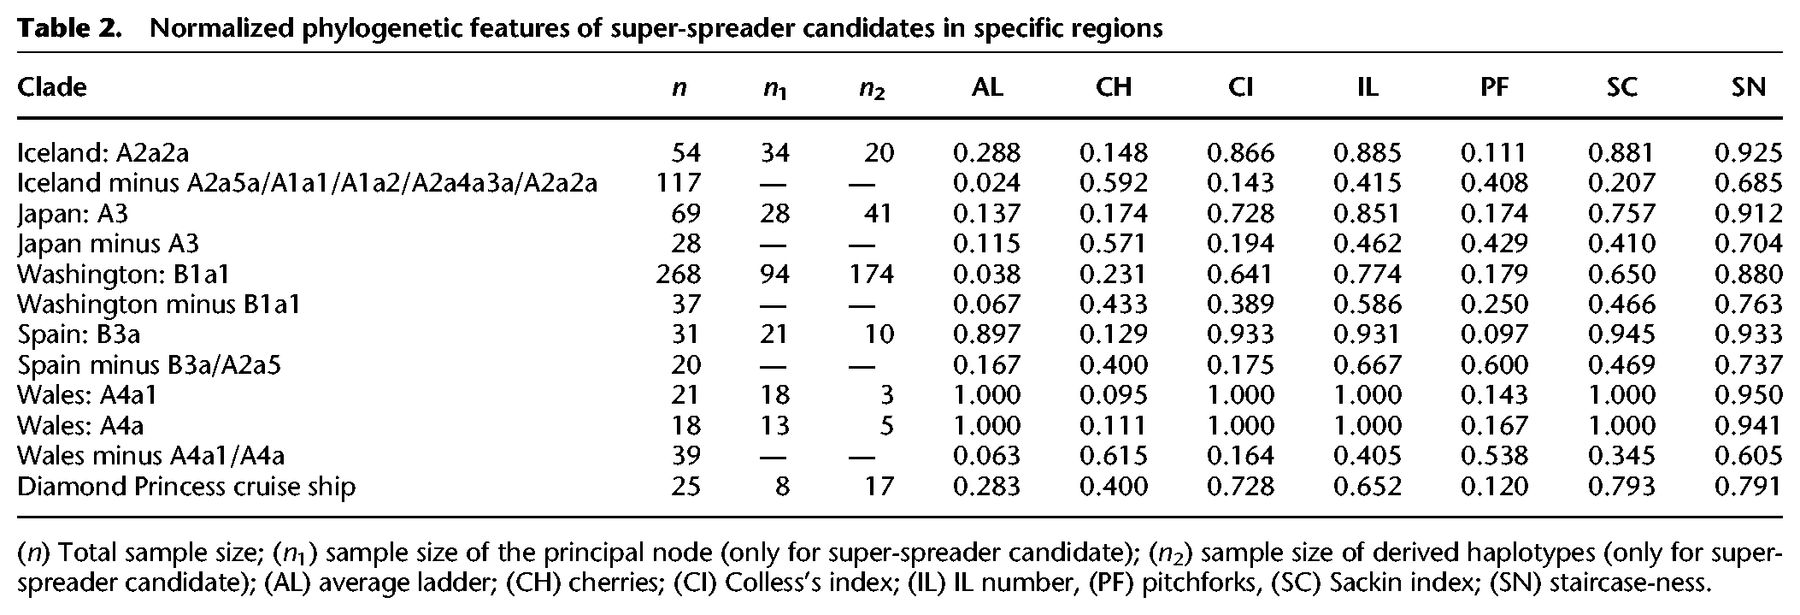
We further explored the phylogenies of these high-frequency haplotypes to gain insight into transmission patterns (Fig. 5); in particular, we were interested in exploring if these patterns are consistent with the figure of super-spreader hosts. Table 2 shows normalized phylogenetic tree features for a selected number of super-spreader candidates. For each geographic region, we additionally obtained index values for the rest of the tree excluding these candidates. The phylogenetic trees have expected values compatible with super-spreader transmissions and less compatible with homogeneous and chains of transmissions (overall if considering the phylogenies coupled with the moderate mutation rate of SARS-CoV-2 and the mean incubation period of COVID-19). For instance, clade A2a2a in Iceland has a Colless's index of 0.866, but this value is only 0.143 when excluding candidate super-spreaders nodes. The IL number (A2a2a: 0.885 vs. Remaining Tree (RT): 0.415), the Sacking index (A2a2a: 0.881 vs. RT: 0.207), and the staircase-ness (A2a2a: 0.925 vs. RT: 0.685) are also consistently high as expected from super-spreader transmissions. Also consistent with this super-spreader model of transmission are the low values observed for the cherries (A2a2a: 0.148 vs. RT: 0.592) and pitchforks (A2a2a: 0.111 vs. RT: 0.408). The rest of the super-spreader networks in Supplemental Table S4 follow similar patterns.
Network analysis of main super-spreader candidates (see also Supplemental Data; Supplemental Table S4) in various geographic regions. A network was first computed for all the haplotypes in the region, and a zoomed network was built for the main super-spreader candidates. Areas of the circles are proportional to the number of haplotypes. In the case of B1a1 representation (Washington state; USA), only derived haplotypes from the core with one or two mutations are represented in the left subgraph. Heptagons in branches indicate the number of mutations in the corresponding branch.
Normalized phylogenetic features of super-spreader candidates in specific regions
Networks of super-spreader candidates (Fig. 5) show a starlike shape, which is characteristic of super-spreader transmission (Colijn and Gardy 2014) and clearly differs from other patterns in the general tree that are more characteristic of homogeneous or chain transmissions. The most outstanding super-spreader event occurred in Washington state (Fig. 5). This network involved about 328 genomes, and its shape suggests that a single super-spreader (carrying a coronavirus belonging to B1a1 lineage) could have driven an important proportion of coronavirus transmissions involved in the basal node. However, the data available in the present study cannot conclusively identify if the sequences depicted in the network and representing an important proportion of a single subclade were the result of one or a few super-spreaders; such level of detail might only be determined using epidemiological and clinical data (see Discussion).
Values for the Diamond Princess cruise ship are also comparable to those obtained for the super-spreader candidates (Table 2; Supplemental Material; Supplemental Fig. S12).
Evolution of effective population size of SARS-CoV-2
Extended Bayesian skyline plot (EBSP) analysis undertaken on genomes sampled until the end of February (Supplemental Material) reflects with great precision the main COVID-19 epidemiological episodes. If we consider the estimated TMRCA for SARS-CoV-2 to November 12, 2019, and allowing 14–24 d of disease incubation (until approximately December 6), this leaves a period of 2 or 3 wk of silent local transmission of the virus until the first case is reported in Wuhan on December 30, 2019. From this moment, Ne begins to increase slightly for a couple of weeks (Fig. 6B), followed by exponential growth from January 20, 2020, coinciding with the Asian outbreak. The peak is reached on January 30, matching the Asian lockdown. Consequently, Ne drops for the next couple of weeks, but starts to grow progressively again from February 12, coinciding with the beginning of the non-Asian outbreak.
Phylogenetic and phylodynamics of SARS-CoV-2, and timeline of the pandemic. (A) Simplified SARS-CoV-2 phylogeny (schematic version of Fig. 3) illustrating the main worldwide branches and the haplogroups responsible for the main outbreaks (founders favored by super-spreading) occurring in Asia and outside Asia (colored filled circles). The overall distribution color keys refer only to pie charts, and the main founder color keys refer only to filled circles. (B) EBSP based on genomes sampled from the beginning of the pandemic until the end of February 2020 (n = 621). The orange distribution shows the real number of cases per day as recorded in https://ourworldindata.org for the same time period (we disregarded the abnormal peak occurring on February 13, 2020, because more than 15,000 new cases were reported in China in just 1 d, most likely representing unconfirmed cases). (C) Time line of the main events occurring during the pandemic, and indicating the MRCA of all SARS-CoV-2 genomes; the dotted area is a schematic representation of the real diversity values reported in Supplemental Figure S10 and Supplemental Table S3. Divergence dates between SARS-CoV-2 and bat sarbecoronavirus reservoir and between bat and pangolin coronaviruses were taken from Boni et al. (2020).
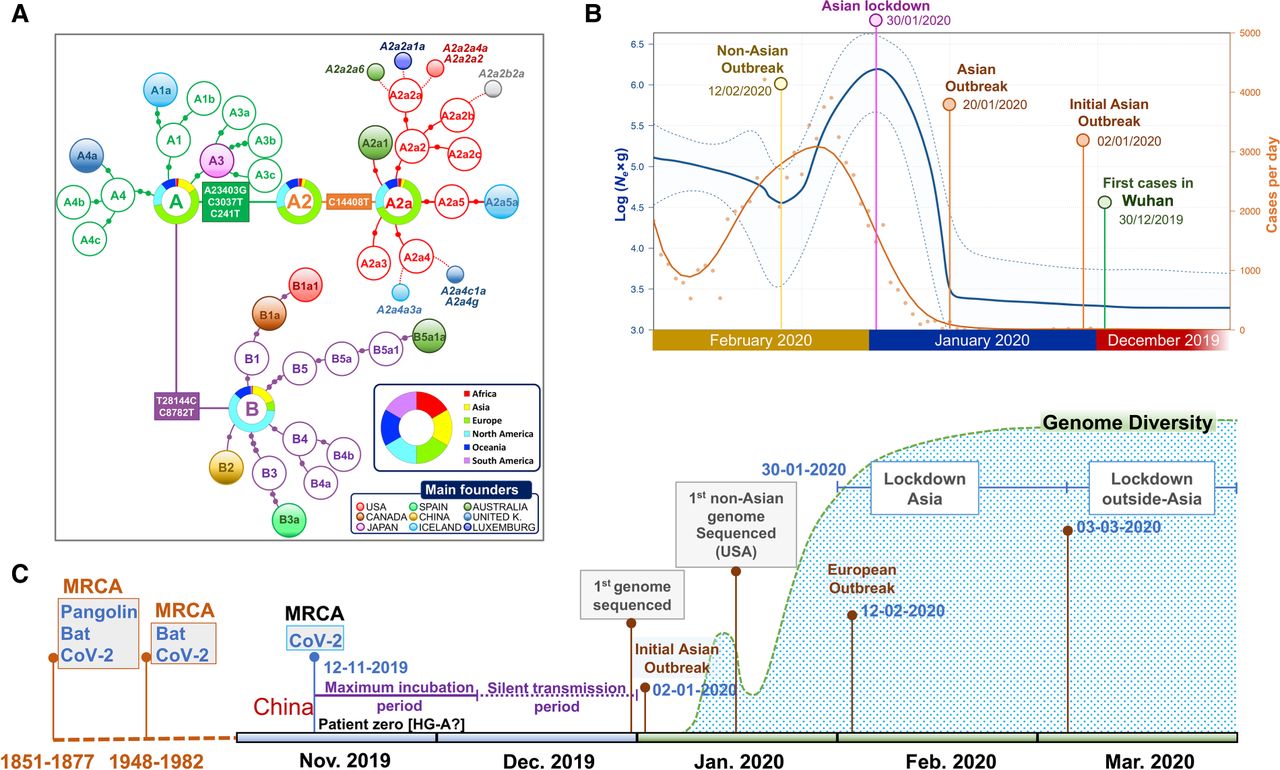
By overlaying COVID-19 incidence (officially reported cases per day worldwide; https://ourworldindata.org) to the EBSP plot, we observed comparable shape distributions, but with a 14–15 d delay in reported cases per day worldwide relative to the EBSP distribution (Fig. 6B).
Association of SARS-CoV-2 lineages with sex and age
Age and sex distribution vary among countries sampled (Supplemental Fig. S13). Several statistical tests were carried out to explore the possible association between coronavirus strains, age, and sex. After correcting for multiple tests, we did not find solid evidence indicating significant associations between these two variables and the SARS-CoV-2 main clades (Supplemental Material; Supplemental Table S5).
Discussion
We undertook a large-scale analysis of SARS-CoV-2 genomes considering a sample size that is more than an order of magnitude higher than those of previous studies. By focusing on high-quality (HQ) genomes, we devoted great effort to elucidate the most parsimonious phylogeny of SARS-CoV-2. Thus, we present novel phylogeographic inferences on the origin and dynamics of SARS-CoV-2 strains. In particular, we discussed the conflicting evidence on the origin of SARS-CoV-2 and discovered a few dozen genomes (representing more than one-third of the total database) that played a fundamental role in the spread of COVID-19. These SARS-CoV-2 strains (belonging to different haplogroups) occurred with high frequency in the data set in short time periods (of a few days) and became founders in restricted regions or countries (Fig. 6A); the phylogenic characteristics of these haplotypes are compatible with the existence of super-spreaders playing an important role in the propagation of the COVID-19 pandemic.
A practical application of the SARS-CoV-2 tree built in the present study is to facilitate classification of genomes into clades, which might facilitate the work of epidemiologists and other specialists seeking potential correlations between clade members and the different clinical phenotypes observed in COVID-19, disease severity, and differential spread of the disease worldwide. The phylogeny presented is scalable, and nomenclature works in a hierarchical way similar to that shown to be successful in other research areas such as human population genetics (e.g., mtDNA studies). In addition, we consider that a stable nomenclature is needed to facilitate future comparisons. For instance, Nextstrain has recently changed the nomenclature of main branches, while haplogroups A and B in Forster et al. (2020) are inverted with respect to A and B in the previous version of Nextstrain (and here); overall, these different nomenclatures (and others used in preprints) add to the confusion when comparing different studies.
SARS-CoV-2 genomes show very high identity among themselves (>99%) and lower to bat coronaviruses (>96%; BatCoV RaTG13); these values are very similar to earlier estimates based on a limited number of SARS-CoV-2 genomes (Ceraolo and Giorgi 2020; Coutard et al. 2020; Lam et al. 2020; Tang et al. 2020). The pangolin coronavirus genome, initially proposed as the original host of SARS-CoV-2, shows significantly lower identity. The high identity observed between SARS-CoV-2 genomes and other betacoronaviruses adds support to its zoonotic origin from a bat relative (Ceraolo and Giorgi 2020). The differences found between SARS-CoV-2 and their most closely related coronaviruses in horseshoe bat indicate that a large number of mutational jumps was needed to generate these differences from a common ancestor that could have existed in a time frame between 1948 and 1982 (Boni et al. 2020). Divergent genomes could have been incubated in animal reservoirs before the occurrence of the zoonotic jump to humans in the shape of an A or a B genome, in a process similar to that observed for palm civet as intermediary in other SARS coronaviruses (Hu et al. 2017). These new coronaviruses would be able to use human ACE2 receptor to infect patient cells. Patterns of variation observed in SARS-CoV-2 could be explained assuming a unique index case, which would already contain the very specific and well-conserved 12 nt polybasic furin cleavage site (PFCS) insertion. This original SARS-CoV-2 genome would then start to diverge very soon in Wuhan in two directions of the phylogeny, giving rise to the two main branches: haplogroup A had more success in the non-Asian pandemic, whereas haplogroup B achieved only local success in some particular regions outside Asian (e.g., sublineage B1a1 in the United States, or B3a in Spain) (Fig. 6C, time line). In selecting a root for the phylogeny, we prioritized A (genome chronology and phylogeographic criteria) over B1 (ML trees). For B1 (or B2 or even B) to be the real root for the SARS-CoV-2, we would need to assume an exceptionally large period for B genomes remaining unsampled, which is incompatible with the mutation rates and life span of coronavirus strains (Fig. 2B). A root in haplogroup A would also be supported by a more recent TMRCA (December 2, 2019, compared to December 20, 2020 for haplogroup B).
According to our inferences, the TMRCA for all SARS-CoV-2 genomes would be November 12, 2019. Assuming a maximum incubation time in humans of up to 24 d (Guan et al. 2020), the virus could have been infecting the first citizens from Hubei in a silent mode of transmission until the end of November 2019 and started to be noticed by Chinese health authorities in early to mid-December. The EBSP distribution suggests that the effective population size (Ne) of SARS-CoV-2 started to grow significantly from December 30, 2019, that is, only 2–3 wk after the initial cases were reported, and was probably favored by super-spreaders; for example, genomes like the reference sequence (H4) (Supplemental Table S4) played a special role in the beginning of the Asiatic epidemic. Subsequently, it followed an exponential growth that marked the beginning of the Asian outbreak on January 20, 2020, and lasted until the end of January. Next, Ne experienced a notable drop coinciding with human intervention and quarantine implemented in Asia on January 30, 2020. Finally, the beginning of a second wave of expansion outside Asia starting around February 12–27, 2020, is also well-recorded on the SARS-CoV-2 genomes (Fig. 6B).
The 2-wk delay between the dates suggested by the EBSP distribution and the official documented incidence of COVID-19 in Asia could be attributable to (1) an underestimate obtained by the EBSP analysis, (2) the mean incubation time of the disease, and/or (3) the number of cases officially declared in this period being below the real incidence of the disease.
Phylogeographic analysis of SARS-CoV-2 genomes allowed us to investigate pandemic dynamics worldwide. Members belonging to clade A were probably among the first ones to leave Asia before this region established a severe population lockdown; and the subclade named A2a, most likely emerging in Europe, gave rise to one of the most successful strains worldwide (it represents 55% of the global database). There is strong evidence pointing to the role of important founder events in the pandemic occurring in many continental regions and restricted locations, especially outside China. Phylogeographic analysis of SARS-CoV-2 genomes also enables us to identify a number of super-spreader candidates (n = 49) (Supplemental Table S4), which might explain the multiple founder events observed worldwide; one of these super-spreading events could have been responsible for the origin and success of A2a. In Iceland, Gudbjartsson et al. (2020) recently showed a contact tracking network (their Fig. 4B) that could represent one of the many super-spreading events that existed in Iceland and that is indirectly observed in our analyses based on genomes. These founder haplotypes have four differential features: (1) they reached high to moderate frequencies, (2) they are characteristic of specific continental regions or even individual countries, (3) they appeared in a very short time period of only a few days, and (4) the variation emerging from the core haplotypes (Fig. 5; Table 2) has to a great extent the signature expected from super-spreaders. Therefore, although these analyses do not allow investigating individual transmissions, overall, they allow identifying a phylogenetic pattern that is compatible with super-spreaders and that differs from the signal generated by transmission chains and homogeneous transmissions. The data suggest that these genomes could have played a fundamental role in COVID-19 spreading for the period represented in the database; they alone represent 34% of the total genomes in the database, but their impact could be higher if we consider all the derived haplotypes emerging from each founder. This finding is in good agreement with recent results from epidemiological studies and observations as well as mathematical simulations (Endo et al. 2020; Kupferschmidt 2020) indicating important individual-level transmission in COVID-19, with dispersion parameter k estimated to be around 0.1. Moreover, the role of super-spreaders is well reported in previous pandemics, including SARS, MERS, and Ebola (Stein 2011; Wong et al. 2015).
With the data available in GISAID, we were not able to detect association between main haplogroups and age and sex. However, further research is needed to investigate the possible differential effect of strains (haplogroups) with the disease outcome and biological traits.
Evidence of natural selection acting on SARS-CoV-2 genomes needs further investigation (Supplemental Material), although the data suggest purifying selection acting on most of the SARS-CoV-2 genes when explored at an interspecific level, and weaker intraspecific purifying selection. In agreement with this latter observation is the recent report indicating an 81-nt deletion at gene ORF7a that would convert the coronaviruses into a less virulent pathogen with reduced short-term selective advantage (Holland et al. 2020). However, none of the HQ genomes investigated in our report carry this deletion.
We found the PFCS in all SARS-CoV-2 genomes with only two exceptions (belonging to different haplogroups) (Supplemental Material). This segment is therefore highly mutationally stable. A BLAST search (https://blast.ncbi.nlm.nih.gov/) of the PFCS indicates that this sequence segment is specific to SARS-CoV-2. The fact that the PFCS has been found universally in all SARS-CoV-2 suggests that this insertion was acquired before the zoonotic event (and is therefore present in the root, i.e., pre-A) (Fig. 2A,B) and not after (Andersen et al. 2020). The virulence conferred by this deletion to the coronaviruses constitutes the focus of several studies (Lau et al. 2020).
In the last few months, the nucleotide change leading to the amino-acid mutation D614G has also attracted the attention of the scientific community, stimulated by the study of Korber et al. (2020), among others and the media, claiming a fitness advantage for this variant and an increased infectivity of the carrier coronavirus; this mutation is generated by the transversion change A23403T, which is one of the three diagnostic variants of haplogroup A2 (although it shows low mutational recurrence, appearing once within haplogroup B). As shown in the present article, genetic drift and migration (likely favored by super-spreading transmission) has played a fundamental role in the dispersion of SARS-CoV-2; therefore, it seems there is no need to advocate natural selection or a transmission advantage for a particular strain to explain patterns of variation of SARS-CoV-2 genomes worldwide. In support of this claim, some countries with the highest impact of COVID-19 have significantly lower frequencies of this mutation than other reference regions, for example, the frequency of A23403T is 77% in Europe versus 54% in Spain and 42% in the United States. In addition, it was sub-branch A2a that succeeded in its dispersion worldwide, not A2 where D614G first appeared. Therefore, our results do not support claims of D614G being more advantageous in the spread of SARS-CoV-2 around the world. Some reports have called for caution in the interpretation of this mutation and other phylogenetic findings (Villabona-Arenas et al. 2020).
The origin of SARS-CoV-2 has become a very pressing question. The results of the present study (TMRCA dating of SARS-CoV-2, EBSP plot, and phylogeny) and the chronology of the genomes are compatible with an index case living in Wuhan-China, most likely belonging to basal haplogroup A (but could also belong to haplogroup B1 or B2), and existing not before the beginning of November 2019. Subsequently, the coronavirus was transmitted from a living animal (not necessarily bat) to a human host and then it started to spread from human to human. By analyzing stored biological samples from cases occurring at the beginning of the epidemic in Wuhan, it would be possible to narrow down the search for patient zero among those belonging to the root. The phylogeny built in the present study would be compatible with a single patient zero initiating the epidemic. Identifying the index case would help better understand how and when the spread of the pandemic began, a lesson that would be useful in future pandemics. In agreement with previous studies (Andersen et al. 2020), the theory of SARS-CoV-2 originating artificially in a laboratory finds no support in the results of the present study, in the sense that variation (within and between other species), and the stepwise mutational evolution observed at SARS-CoV-2 genomes is as expected for a RNA virus in nature.
This study has several limitations (Supplemental Material) and it warrants further expansion to clarify the role of super-spreaders in COVID-19 by investigating epidemiological data locally. Detecting and analyzing the genome of super-spreaders might shed light on the specific host genetic background (if any) contributing to their increased propensity to transmit the pathogen, as well as to understand the mechanisms of infection and transmission of the pathogen. Moreover, the phylogenic precision to which we classified SARS-CoV-2 genomes will also serve disease studies aimed at understanding the potential role of different pathogen strains in disease outcomes, and how these lineages correlate to, and interact with, host genomic susceptibility. Analysis of variation of SARS-CoV-2 genomes worldwide is fundamental for vaccine design (because there could be variants affecting antigenicity and immunogenicity) (Kim et al. 2020), as well as for diagnostics (Artesi et al. 2020). We have shown that a comprehensive phylogeographic analysis based on HQ SARS-CoV-2 genomes can provide useful information about the virus spread patterns and dynamics, not only from a global perspective but also for events that occur in particular geographic regions.
Methods
Database of SARS-CoV-2 sequences
We downloaded 4721 complete genomes from the GISAID database (https://www.epicov.org/epi3/frontend) on April 6, 2020; 3392 of these 4721 sequences were noted as high quality (HQ; >29 kbp, high cover only) based on the information provided by GISAID on April 8, 2020. In order to minimize background noise originating from potential sequencing errors, we carried out analyses using the HQ SARS-CoV-2 genomes (for more information on the features of the database, see Results, Supplemental Material, and Supplemental Figure S14) unless stated otherwise. A higher mutation rate is expected in indels and MNPs; therefore, unless specified, this variation (together with all the ambiguities) was eliminated from all the analyses to simplify phylogenetic reconstructions and to allow visualization of main patterns of variation. Although SARS-CoV-2 is an RNA virus, the data deposited in GISAID are in DNA format. Metadata for these genomes was downloaded from the Nextstrain repository (https://github.com/nextstrain/ncov/tree/master/data) on April 7, 2020; this contains information on geographic location of the sample (city, country, and continental region) date of recruitment (submission date are also available in GISAID but were not used in our analyses), age, sex, and so forth. We also downloaded coronavirus genomes from nine pangolins mainly sampled in the Guangdong province (GISAID IDs [omitting prefix “EPI_ISL_“]): #410544, #410721, #412860, #410539, #410538, #410543, #410542, #410541, and #410540), three bats (#402131, #412977, and #412976) and the reference SARS-CoV-1 genome (GenBank accession number: NC_004718.3). In addition, we downloaded viral genomes analyzed from a tiger (GISAID: #420293) and a dog (GISAID: #414518) presumably infected with SARS-CoV-2 by humans.
The SARS-CoV-2 genomes were aligned against the reference sequence used by, for example, Nextstrain and many investigators, with GenBank accession number MN908947.3 (submitted on January 5, 2020; GISAID ID #402125). This was the first SARS-CoV-2 genome released on GenBank.
Alignment of SARS-CoV-2 genomes against the reference sequence was carried out using MUSCLE v3.8.31 software (Edgar 2004) and refined manually.
Apart from the discarded low-quality (LQ) sequences, we trimmed the 5′ and 3′ untranslated regions to ensure comparability among genomes, retaining a consensus sequence of 29,607 bp that runs from position 169 to position 29776. In the text, we use indistinctly the terms lineage, haplogroup, clade, cluster, and strain.
Interspecific phylogenetic analysis
We built maximum likelihood (ML) trees to investigate interspecific phylogenetic relationships between SARS-CoV-2 genomes and genomes analyzed from nine pangolins, three bats, and the reference SARS-CoV-1 genome (GenBank accession number: NC_004718.3). Interspecific alignment was carried out using the MAFFT program (Katoh et al. 2002) with default parameters. Genetic distances (F84) were computed using dnadist and default parameters, and the tree was built using dnapars; both programs are included in the Phylip-3.697 software (Felsenstein 1989). With the SARS-CoV-2 genes aligned for all genomes with nucleotides in frame, and the ML trees, we used PAML 4 (Yang 2007) to compute the statistics ω = Ka/Ks (also known as dN/dS), where Ka is the number of nonsynonymous substitutions per nonsynonymous site, and Ks refers to synonymous substitutions per synonymous site. This ratio allows measuring the strength and mode of natural selection acting on the protein genes (Supplemental Table S6).
Intraspecific phylogeny of SARS-CoV-2
There have been several attempts at reconstructing the phylogeny of SARS-CoV-2 genomes. At present, there is no consensus phylogeny identifying the mutational changes characterizing main clades and subclades. The interactive web-phylogeny presented by Nextstrain is probably the most elaborate attempt carried out to date; this resource defines two main branches, A and B, and nine sub-branches that cluster a variable number of sequences ranging from only three (haplogroup A7) or 52 sequences (haplogroup A6) to 2279 (A2a) (April 28, 2020). GISAID identifies three large clades according to changes located in the ORF8 gene and other sequence variants: (1) Clade S: change L84S, with S referring to the SARS-CoV-2 spike S-glycoprotein located on the surface of the viral envelope, and sequence variant T28144C; (2) Clade G: change D614G and sequence variant A23404G; and (3) Clade V: NSP3-G251V and sequence variant G26144T. In addition, GISAID refers to the category “Other,” which is in reality paraphyletic. GISAID uses the reference sequence of a SARS-associated coronavirus sequenced in 2003 (Marra et al. 2003). The GISAID tree comes from Nextstrain; and the latter was built following a ML approach using IQ-TREE (Nguyen et al. 2015). Many of the earlier attempts published in regular journals used a small number of genomes, and the proposed nomenclature adds to the confusion; for instance, Forster et al. (2020) also distinguished between A and B, but in the opposite sense as in the original Nextstrain nomenclature (and here).
We used different strategies to build the intraspecific phylogeny of SARS-CoV-2. First, a phylogeny based on ML was built to find the phylogenetic root of all SARS-CoV-2 using the most similar (higher identity) pangolin and bat coronavirus to the SARS-CoV-2 genome as outgroups (GISAID IDs [omitting prefix “EPI_ISL_“]): #410721 and #402131, respectively). In the particular case of SARS-CoV-2 and taking into account epidemiological evidence, we know for sure that its root is among the initial genomes sequenced in China (most likely in the Hubei province). First we used only genomes collected before February 29, 2020 (n = 621), and then genomes sampled only until mid-January (thereby excluding B1 genomes) to reduce the noise in ML trees generated by an unnecessarily large number of genomes that were sampled and spread outside China.
In addition, we also constructed the ML phylogeny using the whole genome database to find further support for the tree generated by maximum parsimony (see below).
We constructed all the ML trees with RAxML-HPC v.8 (Stamatakis 2014) and using rapid bootstrapping analysis with 1000 iterations. The best ML trees were visualized and edited with FigTree v.1.4.4 (http://tree.bio.ed.ac.uk/software/figtree/). Subsequently, the most parsimonious strategy allowed us to determine the main and secondary subclades of the SARS-CoV-2 tree, identifying the characteristic mutations of clades. This phylogenetic procedure also allows us to count the occurrences of mutations along branches, which serves as a good proxy for mutation-specific stability (Weissensteiner et al. 2016). We followed the quality standards used to generate the most robust molecular phylogeny based on maximum parsimony, namely, human mtDNA (van Oven and Kayser 2009). However, the novelty of SARS-CoV-2 genomes and the use of a variety of high-throughput sequencing techniques (Bandelt and Salas 2012) prevents the filtering out of sequencing errors as efficiently as in other well-known haplotypic-based phylogenies (Salas et al. 2005). Thus, we built the parsimony tree by hand using the following decision steps with regard to data filtering:
We used only genomes labeled as “high-coverage only” and “complete” in GISAID.
We collapsed the sequences to the common sequence segment. High-throughput sequencing procedures generate artifacts at the 5′ and 3′ ends of the genome sequences, which generally consist of deletions. Before eliminating the extremes of the sequences, we checked the complete genomes available to see if there were any variants that could be phylogenetically informative.
A solid phylogeny should be based on stable mutational variants; thus, only branches supported by at least five genomes were considered.
Because many sub-haplogroups are supported by single mutations, we only considered those having mutational stability (here, equivalent to only a few occurrences along the most parsimonious tree).
We used a nomenclature of clades that is as conservative as possible with Nextstrain but avoiding alteration of basic cladistic rules (e.g., B1 cannot be ancestral of B).
By simple counting of the mutational hits along the branches and at the tips of the phylogeny, it is possible to infer the relative mutation stability of diagnostic sites. The mutations at the tips of the phylogeny were counted only once within each terminal branch. Supplemental Table S1 reports the number of occurrences in both the tree branches and in the tips of the phylogeny. Recurrence of mutations along branches of the phylogeny is low, which makes the tree very robust (Supplemental Material).
Phylogeny of super-spreader event
According to Colijn and Gardi (2014) “there are simple structural properties of phylogenetic trees which, when combined, can distinguish communicable disease outbreaks with a super-spreader, homogeneous transmission and chains of transmission.” Further, Leventhal et al. (2012) state that “The level at which a phylogenetic tree is able to resolve any contact structure depends on the rate of evolution of the pathogen. In cases such as HIV, where the rates of evolution are high enough to result in substantial genetic differences between virus populations of individual hosts, a phylogenetic tree may reveal contact structure down to the individual level.” Because the SARS-CoV-2 has a comparable evolution rate as HIV (Lemey et al. 2006; Patiño-Galindo and González-Candelas 2017; Zanini et al. 2017), we carried out phylogenetic analysis aimed at distinguishing patterns of transmission.
In particular, we are interested in computing phylogenetic features of SARS-CoV-2 transmissions for our best candidates (those haplotypes that experienced a high frequency locally and in a short time period) and comparing them to those obtained using the remaining haplotypes from the same specific region. We first built phylogenetic trees from sequence alignments using SplitsTree5 (Huson and Bryant 2006). We used the R library phylotop (https://cran.r-project.org/web/packages/phyloTop/) to calculate the following tree features (Colijn and Gardy 2014):
Cherry number/n: the number of cherries over number of leaves. Cherries are pairs of genomes where one infected the other one while any of them went on to infect anyone else. It is slightly lower and more variable for super-spreader outbreaks.
Colless's I (index) or imbalance: It reaches higher values for super-spreader outbreaks.
IL number: portion of internal nodes with one leaf descendant. It reaches higher values for super-spreader outbreaks.
Pitchforks: Like cherries, pitchforks decrease with increasing infection rate (Metzig et al. 2019).
Sacking index: the mean path length from tip to root. Slightly higher in super-spreader outbreaks and lower in chain outbreaks.
Staircase-ness: the portion of imbalance nodes (Norström et al. 2012). It shows much lower values for chain outbreaks.
In addition, we also carried out network analyses for the same super-spreader candidate clades and also for a reported event of a super-spreader host that occurred on the Diamond Princess cruise ship for which we could access 25 SARS-CoV-2 genomes. According to Sekizuka et al. (2020), the super-spreading event occurring in the cruise ship may have originated from a single COVID-19 patient who had disembarked in Hong Kong on January 25, 2020.
To visualize the candidate super-spreader networks, we built phylogenetic median joining networks using POPART software (Leigh and Bryant 2015). The shape of the networks was double-checked using other algorithms implemented in POPART; we could not detect appreciable differences.
Statistical analysis
The average number of nucleotide differences per site between DNA sequences or nucleotide diversity (π) (Nei and Li 1979), sequence/haplotype diversity (HD), and Tajima's D statistics (Tajima 1989) were computed for the main continental regions, haplogroups, and gene partitions. Tajima's D is a test for neutrality in the context of infinite-sites model of sequence evolution, and it is negligibly affected by S, sample size, and recombination (Ramírez-Soriano et al. 2008).
Multidimensional scaling (MDS) was undertaken to identify clusters of genetic variation by examining (1) all the variation observed in the SARS-CoV-2 genomes, and (2) the phylogenetic diagnostic variants of the SARS-CoV-2 tree inferred from parsimony. For this, we used the function cmdscale (library stats) from the statistical software R Project for Statistical Computing v. 3.3.1 (https://www.R-project.org/) (R Core Team 2019).
The geographic representation of haplogroup frequencies in world maps was carried out using SAGA v. 7.6.2 (http://www.saga-gis.org/) (Conrad et al. 2015) and the ordinary Kriging method. We used only regional data sets with more than 10 genomes; to avoid unnecessary loss of sampling points, a few of them were collapsed into nearest points to represent local areas, whenever possible, to reach the minimum sampling required.
From the sequence alignments and annotated files, we summarized information on mutational patterns in the SARS-CoV-2 genomes (Supplemental Tables S7, S8; Supplemental Material). We used a Fisher's exact test to check if there were differences in the transition-to-transversion ratio (ts/tv), and the synonymous/nonsynonymous changes.
Supplemental Table S9 contains predicted pathogenicity values of the variants observed in the genomes analyzed in the present study.
The ML tree and sampling dates were used for estimating the TMRCA and molecular rates, fitting a molecular clock to the phylogeny through a fast relaxed-clock method based on a Gamma-Poisson mixture model of substitution rates, and using the R package treedater (Volz and Frost 2017). We used the relaxed clock because it offered a better fit to the data; it also identified and removed tip outlier lineages to obtain a tree that better suited the molecular clock. We estimated confidence intervals for rates and dates using a parametric bootstrap approach.
The demography of SARS-CoV-2 sequences was inferred using the extended Bayesian skyline plot method (EBSP) (Heled and Drummond 2008) implemented in BEAST v2.6.2 (Drummond and Rambaut 2007). EBSPs allow the inference of effective population size (Ne) through time and also estimate the number of demographic changes from the data. We used a strict clock and a rate of evolution of 0.80 × 10⁻³ [0.14 × 10⁻³ to 1.31 × 10⁻³] s/s/y based on recent estimations (https://virological.org/t/phylodynamic-analysis-176-genomes-6-mar-2020/356). Two independent Markov chain Monte Carlo (MCMC) runs of 200,000,000 steps each were performed, with samples taken every 1000 steps and 10% discarded as burn-in. Following Tracer (v. 1.6) output (http://tree.bio.ed.ac.uk/software/tracer/) (Drummond and Rambaut 2007) inspection for distributions convergence, both runs were combined independently using LogCombiner v1.8.2 (Drummond and Rambaut 2007), with 10% discarded as burn-in. EBSP data was plotted using R software (R Core Team 2019).
The metadata in GISAID contains information on the sex and age of the COVID-19 patients. These data, in combination with the phylogeny, allow investigating for possible association among haplogroups, sex, and age. Association tests were carried out for the main (sub)haplogroups (A, B, A1a, A2a, A3, A3a, A4a, A9b, B1a, B3a; all with sample size >50). We carried out a Mann–Whitney U test to analyze haplogroup association with age. Because each region has its own haplogroup frequency patterns and epidemiological characteristics, we considered a nonparametric Kruskal–Wallis test using all the sampling data per regions and main haplogroups. Association between haplogroups/regions and sex was explored using the Fisher's exact test. The nominal significance value was set to 0.05. Bonferroni adjustment was used to account for multiple testing.
In-house R and Nim (http://nim-lang.org) scripts (uploaded to https://gitlab.com/xbello/gr_2020) (Supplemental Code) were used to display results obtained from the different software packages used.
Competing interest statement
The authors declare no competing interests.
Acknowledgments
This study received support from the Instituto de Salud Carlos III: project GePEM (Instituto de Salud Carlos III(ISCIII)/PI16/01478/Cofinanciado FEDER), DIAVIR (Instituto de Salud Carlos III(ISCIII)/DTS19/00049/Cofinanciado FEDER; Proyecto de Desarrollo Tecnológico en Salud) and Resvi-Omics (Instituto de Salud Carlos III(ISCIII)/PI19/01039/Cofinanciado FEDER) and project BI-BACVIR (PRIS-3; Agencia de Conocimiento en Salud (ACIS)—Servicio Gallego de Salud (SERGAS)—Xunta de Galicia; Spain) given to A.S.; and projects ReSVinext (Instituto de Salud Carlos III(ISCIII)/PI16/01569/Cofinanciado FEDER), and Enterogen (Instituto de Salud Carlos III(ISCIII)/ PI19/01090/Cofinanciado FEDER) given to F.M.-T. We thank GISAID and the contributing laboratories for giving us access to the SARS-CoV-2 genomes used in the present study (Supplemental Table S10).
Notes
[1] Supplementary material [Supplemental material is available for this article.]
[2] Article published online before print. Article, supplemental material, and publication date are at http://www.genome.org/cgi/doi/10.1101/gr.266221.120.
References
- ↵Andersen KG, Rambaut A, Lipkin WI, Holmes EC, Garry RF. 2020. The proximal origin of SARS-CoV-2. Nat Med 26: 450–452. 10.1038/s41591-020-0820-9
- ↵Artesi M, Bontems S, Gobbels P, Franckh M, Maes P, Boreux R, Meex C, Melin P, Hayette MP, Bours V, 2020. A recurrent mutation at position 26,340 of SARS-CoV-2 is associated with failure of the E-gene qRT-PCR utilized in a commercial dual-target diagnostic assay. J Clin Microbiol doi.org/10.1128/JCM.01598-20
- ↵Bandelt HJ, Salas A. 2012. Current next generation sequencing technology may not meet forensic standards. Forensic Sci Int Genet 6: 143–145. 10.1016/j.fsigen.2011.04.004
- ↵Boni MF, Lemey P, Jiang X, Lam TT, Perry BW, Castoe TA, Rambaut A, Robertson DL. 2020. Evolutionary origins of the SARS-CoV-2 sarbecovirus lineage responsible for the COVID-19 pandemic. Nat Microbiol doi.org/10.1038/s41564-020-0771-4
- ↵Ceraolo C, Giorgi FM. 2020. Genomic variance of the 2019-nCoV coronavirus. J Med Virol 92: 522–528. 10.1002/jmv.25700
- ↵Colijn C, Gardy J. 2014. Phylogenetic tree shapes resolve disease transmission patterns. Evol Med Public Health 2014: 96–108. 10.1093/emph/eou018
- ↵Conrad O, Bechtel B, Bock M, Dietrich H, Fischer E, Gerlitz L, Wehberg J, Wichmann V, Böhner J. 2015. System for automated geoscientific analyses (SAGA) v. 2.1.4. Geosci Model Dev 8: 1991–2007. 10.5194/gmd-8-1991-2015
- ↵Coutard B, Valle C, de Lamballerie X, Canard B, Seidah NG, Decroly E. 2020. The spike glycoprotein of the new coronavirus 2019-nCoV contains a furin-like cleavage site absent in CoV of the same clade. Antiviral Res 176: 104742. 10.1016/j.antiviral.2020.104742
- ↵Drummond AJ, Rambaut A. 2007. BEAST: Bayesian evolutionary analysis by sampling trees. BMC Evol Biol 7: 214. 10.1186/1471-2148-7-214
- ↵Edgar RC. 2004. MUSCLE: multiple sequence alignment with high accuracy and high throughput. Nucleic Acids Res 32: 1792–1797. 10.1093/nar/gkh340
- ↵Endo A, Abbott S, Kucharski AJ, Funk S. 2020. Estimating the overdispersion in COVID-19 transmission using outbreak sizes outside China. Wellcome Open Res 5: 67. 10.12688/wellcomeopenres.15842.3
- ↵Felsenstein J. 1989. PHYLIP (phylogeny inference package). Cladistics 5: 164–166.
- ↵Forster P, Forster L, Renfrew C, Forster M. 2020. Phylogenetic network analysis of SARS-CoV-2 genomes. Proc Natl Acad Sci 117: 9241–9243. 10.1073/pnas.2004999117
- ↵Guan WJ, Ni ZY, Hu Y, Liang WH, Ou CQ, He JX, Liu L, Shan H, Lei CL, Hui DSC, 2020. Clinical characteristics of coronavirus disease 2019 in China. N Engl J Med 382: 1708–1720. 10.1056/NEJMoa2002032
- ↵Gudbjartsson DF, Helgason A, Jonsson H, Magnusson OT, Melsted P, Norddahl GL, Saemundsdottir J, Sigurdsson A, Sulem P, Agustsdottir AB, 2020. Spread of SARS-CoV-2 in the Icelandic population. N Engl J Med 382: 2302–2315. 10.1056/NEJMoa2006100
- ↵Hadfield J, Megill C, Bell SM, Huddleston J, Potter B, Callender C, Sagulenko P, Bedford T, Neher RA. 2018. Nextstrain: real-time tracking of pathogen evolution. Bioinformatics 34: 4121–4123. 10.1093/bioinformatics/bty407
- ↵Heled J, Drummond AJ. 2008. Bayesian inference of population size history from multiple loci. BMC Evol Biol 8: 289. 10.1186/1471-2148-8-289
- ↵Holland LA, Kaelin EA, Maqsood R, Estifanos B, Wu LI, Varsani A, Halden RU, Hogue BG, Scotch M, Lim ES. 2020. An 81 nucleotide deletion in SARS-CoV-2 ORF7a identified from sentinel surveillance in Arizona (Jan-Mar 2020). J Virol 94: e00711-20. 10.1128/JVI.00711-20
- ↵Hu B, Zeng LP, Yang XL, Ge XY, Zhang W, Li B, Xie JZ, Shen XR, Zhang YZ, Wang N, 2017. Discovery of a rich gene pool of bat SARS-related coronaviruses provides new insights into the origin of SARS coronavirus. PLoS Pathog 13: e1006698. 10.1371/journal.ppat.1006698
- ↵Huang C, Wang Y, Li X, Ren L, Zhao J, Hu Y, Zhang L, Fan G, Xu J, Gu X, 2020. Clinical features of patients infected with 2019 novel coronavirus in Wuhan, China. Lancet 395: 497–506. 10.1016/S0140-6736(20)30183-5
- ↵Huson DH, Bryant D. 2006. Application of phylogenetic networks in evolutionary studies. Mol Biol Evol 23: 254–267. 10.1093/molbev/msj030
- ↵Katoh K, Misawa K, Kuma K, Miyata T. 2002. MAFFT: a novel method for rapid multiple sequence alignment based on fast Fourier transform. Nucleic Acids Res 30: 3059–3066. 10.1093/nar/gkf436
- ↵Kim SJ, Nguyen VG, Park YH, Park BK, Chung HC. 2020. A novel synonymous mutation of SARS-CoV-2: is this possible to affect their antigenicity and immunogenicity? Vaccines (Basel) 8: 220. 10.3390/vaccines8020220
- ↵Korber B, Fischer WM, Gnanakaran S, Yoon H, Theiler J, Abfalterer W, Hengartner N, Giorgi EE, Bhattacharya T, Foley B, 2020. Tracking changes in SARS-CoV-2 spike: evidence that D614G increases infectivity of the COVID-19 virus. Cell 182: 812–827.e9. 10.1016/j.cell.2020.06.043
- ↵Kupferschmidt K. 2020. Why do some COVID-19 patients infect many others, whereas most don't spread the virus at all? Science 10.1126/science.abc8931. https://www.sciencemag.org/news/2020/05/why-do-some-covid-19-patients-infect-many-others-whereas-most-don-t-spread-virus-all.
- ↵Lam TT, Jia N, Zhang YW, Shum MH, Jiang JF, Zhu HC, Tong YG, Shi YX, Ni XB, Liao YS, 2020. Identifying SARS-CoV-2-related coronaviruses in Malayan pangolins. Nature 583: 282–285. 10.1038/s41586-020-2169-0
- ↵Lau SY, Wang P, Mok BW, Zhang AJ, Chu H, Lee AC, Deng S, Chen P, Chan KH, Song W, 2020. Attenuated SARS-CoV-2 variants with deletions at the S1/S2 junction. Emerg Microbes Infect 9: 837–842. 10.1080/22221751.2020.1756700
- ↵Leigh JW, Bryant D. 2015. POPART: full-feature software for haplotype network construction. Methods Ecol Evol 1110–1116. 10.1111/2041-210X.12410
- ↵Lemey P, Rambaut A, Pybus OG. 2006. HIV evolutionary dynamics within and among hosts. AIDS Rev 8: 125–140.
- ↵Leventhal GE, Kouyos R, Stadler T, Wyl V, Yerly S, Boni J, Cellerai C, Klimkait T, Gunthard HF, Bonhoeffer S. 2012. Inferring epidemic contact structure from phylogenetic trees. PLoS Comput Biol 8: e1002413. 10.1371/journal.pcbi.1002413
- ↵Li X, Zai J, Zhao Q, Nie Q, Li Y, Foley BT, Chaillon A. 2020. Evolutionary history, potential intermediate animal host, and cross-species analyses of SARS-CoV-2. J Med Virol 92: 602–611. 10.1002/jmv.25731
- ↵Marra MA, Jones SJ, Astell CR, Holt RA, Brooks-Wilson A, Butterfield YS, Khattra J, Asano JK, Barber SA, Chan SY, 2003. The genome sequence of the SARS-associated coronavirus. Science 300: 1399–1404. 10.1126/science.1085953
- ↵Metzig C, Ratmann O, Bezemer D, Colijn C. 2019. Phylogenies from dynamic networks. PLoS Comput Biol 15: e1006761. 10.1371/journal.pcbi.1006761
- ↵Nei M, Li WH. 1979. Mathematical model for studying genetic variation in terms of restriction endonucleases. Proc Natl Acad Sci 76: 5269–5273. 10.1073/pnas.76.10.5269
- ↵Nguyen LT, Schmidt HA, von Haeseler A, Minh BQ. 2015. IQ-TREE: a fast and effective stochastic algorithm for estimating maximum-likelihood phylogenies. Mol Biol Evol 32: 268–274. 10.1093/molbev/msu300
- ↵Norström MM, Prosperi MC, Gray RR, Karlsson AC, Salemi M. 2012. Phylotempo: a set of R scripts for assessing and visualizing temporal clustering in genealogies inferred from serially sampled viral sequences. Evol Bioinform Online 8: 261–269. 10.4137/EBO.S9738
- ↵Patiño-Galindo JA, González-Candelas F. 2017. The substitution rate of HIV-1 subtypes: a genomic approach. Virus Evol 3: vex029.
- ↵Ramírez-Soriano A, Ramos-Onsins SE, Rozas J, Calafell F, Navarro A. 2008. Statistical power analysis of neutrality tests under demographic expansions, contractions and bottlenecks with recombination. Genetics 179: 555–567. 10.1534/genetics.107.083006
- ↵R Core Team. 2019. R: a language and environment for statistical computing. R Foundation for Statistical Computing, Vienna. http://www.R-project.org/.
- ↵Rehman SU, Shafique L, Ihsan A, Liu Q. 2020. Evolutionary trajectory for the emergence of novel coronavirus SARS-CoV-2. Pathogens 9: 240. 10.3390/pathogens9030240
- ↵Salas A, Carracedo A, Macaulay V, Richards M, Bandelt HJ. 2005. A practical guide to mitochondrial DNA error prevention in clinical, forensic, and population genetics. Biochem Biophys Res Commun 335: 891–899. 10.1016/j.bbrc.2005.07.161
- ↵Sekizuka T, Itokawa K, Kageyama T, Saito S, Takayama I, Asanuma H, Nao N, Tanaka R, Hashino M, Takahashi T, 2020. Haplotype networks of SARS-CoV-2 infections in the Diamond Princess cruise ship outbreak. Proc Natl Acad Sci 117: 20198–20201. 10.1073/pnas.2006824117
- ↵Shen Z, Xiao Y, Kang L, Ma W, Shi L, Zhang L, Zhou Z, Yang J, Zhong J, Yang D, 2020. Genomic diversity of Severe Acute Respiratory Syndrome–Coronavirus 2 in patients with coronavirus disease 2019. Clin Infect Dis 71: 713–720. doi.org/10.1093/cid/ciaa203
- ↵Shu Y, McCauley J. 2017. GISAID: global initiative on sharing all influenza data—from vision to reality. Euro Surveill 22: 30494. 10.2807/1560-7917.ES.2017.22.13.30494
- ↵Stamatakis A. 2014. RAxML version 8: a tool for phylogenetic analysis and post-analysis of large phylogenies. Bioinformatics 30: 1312–1313. 10.1093/bioinformatics/btu033
- ↵Stein RA. 2011. Super-spreaders in infectious diseases. Int J Infect Dis 15: e510–e513. 10.1016/j.ijid.2010.06.020
- ↵Tajima F. 1989. Statistical method for testing the neutral mutation hypothesis by DNA polymorphism. Genetics 123: 585–589.
- ↵Tang X, Wu C, Li X, Song Y, Yao X, Wu X, Duan Y, Zhang H, Wang Y, Qian Z, 2020. On the origin and continuing evolution of SARS-CoV-2. Natl Sci Rev 7: 1012–1023.
- ↵van Oven M, Kayser M. 2009. Updated comprehensive phylogenetic tree of global human mitochondrial DNA variation. Hum Mutat 30: E386–E394. 10.1002/humu.20921
- ↵Villabona-Arenas CJ, Hanage WP, Tully DC. 2020. Phylogenetic interpretation during outbreaks requires caution. Nat Microbiol 5: 876–877. 10.1038/s41564-020-0738-5
- ↵Volz EM, Frost SDW. 2017. Scalable relaxed clock phylogenetic dating. Virus Evol 3: vex025.
- ↵Weissensteiner H, Pacher D, Kloss-Brandstätter A, Forer L, Specht G, Bandelt H-J, Kronenberg F, Salas A, Schönherr S. 2016. Haplogrep 2: mitochondrial haplogroup classification in the era of high-throughput sequencing. Nucleic Acids Res 44: W58–W63. 10.1093/nar/gkw233
- ↵WHO. 2020. WHO Director-General's opening remarks at the media briefing on COVID-19–11 March 2020. https://www.who.int/dg/speeches/detail/who-director-general-s-opening-remarks-at-the-media-briefing-on-covid-19‐‐‐11-march-2020.
- ↵Wong G, Liu W, Liu Y, Zhou B, Bi Y, Gao GF. 2015. MERS, SARS, and ebola: the role of super-spreaders in infectious disease. Cell Host Microbe 18: 398–401. 10.1016/j.chom.2015.09.013
- ↵Wu F, Zhao S, Yu B, Chen YM, Wang W, Song ZG, Hu Y, Tao ZW, Tian JH, Pei YY, 2020. A new coronavirus associated with human respiratory disease in China. Nature 579: 265–269. 10.1038/s41586-020-2008-3
- ↵Yang Z. 2007. PAML 4: phylogenetic analysis by maximum likelihood. Mol Biol Evol 24: 1586–1591. 10.1093/molbev/msm088
- ↵Zanini F, Puller V, Brodin J, Albert J, Neher RA. 2017. In vivo mutation rates and the landscape of fitness costs of HIV-1. Virus Evol 3: vex003. 10.1093/ve/vex003
- ↵Zhao WM, Song SH, Chen ML, Zou D, Ma LN, Ma YK, Li RJ, Hao LL, Li CP, Tian DM, 2020. The 2019 novel coronavirus resource. Yi Chuan 42: 212–221.