
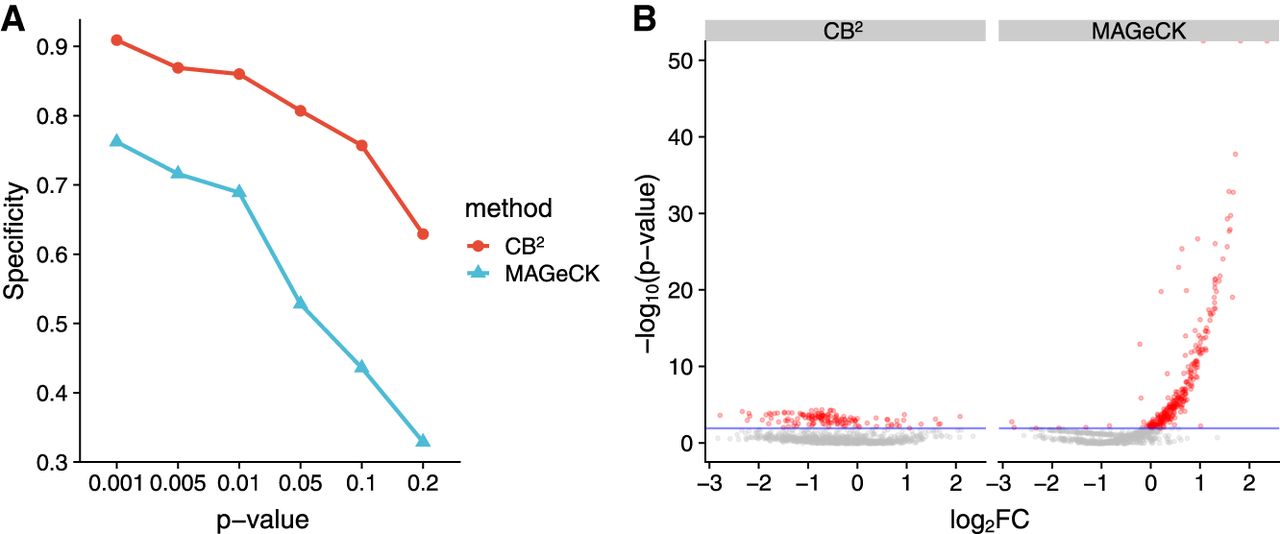
Figure 3.
Comparison of false-positive rate for nontargeting sgRNAs on screen data of Parnas et al. (2015). (A) Specificity comparison between CB2 and MAGeCK for the six different P-value thresholds. The y-axis indicates specificity, and the x-axis indicates the level of the P-value threshold for the specificity calculation. (B) Volcano plots of the P-value of nontargeting sgRNAs. The y-axis indicates the negative logarithm value of P-value, and the x-axis indicates the log2 value of fold-change. All of the data points are from negative control sgRNAs. False positives were plotted in red. Horizontal blue lines at P = 0.01 indicate the threshold for statistical cutoff.


