
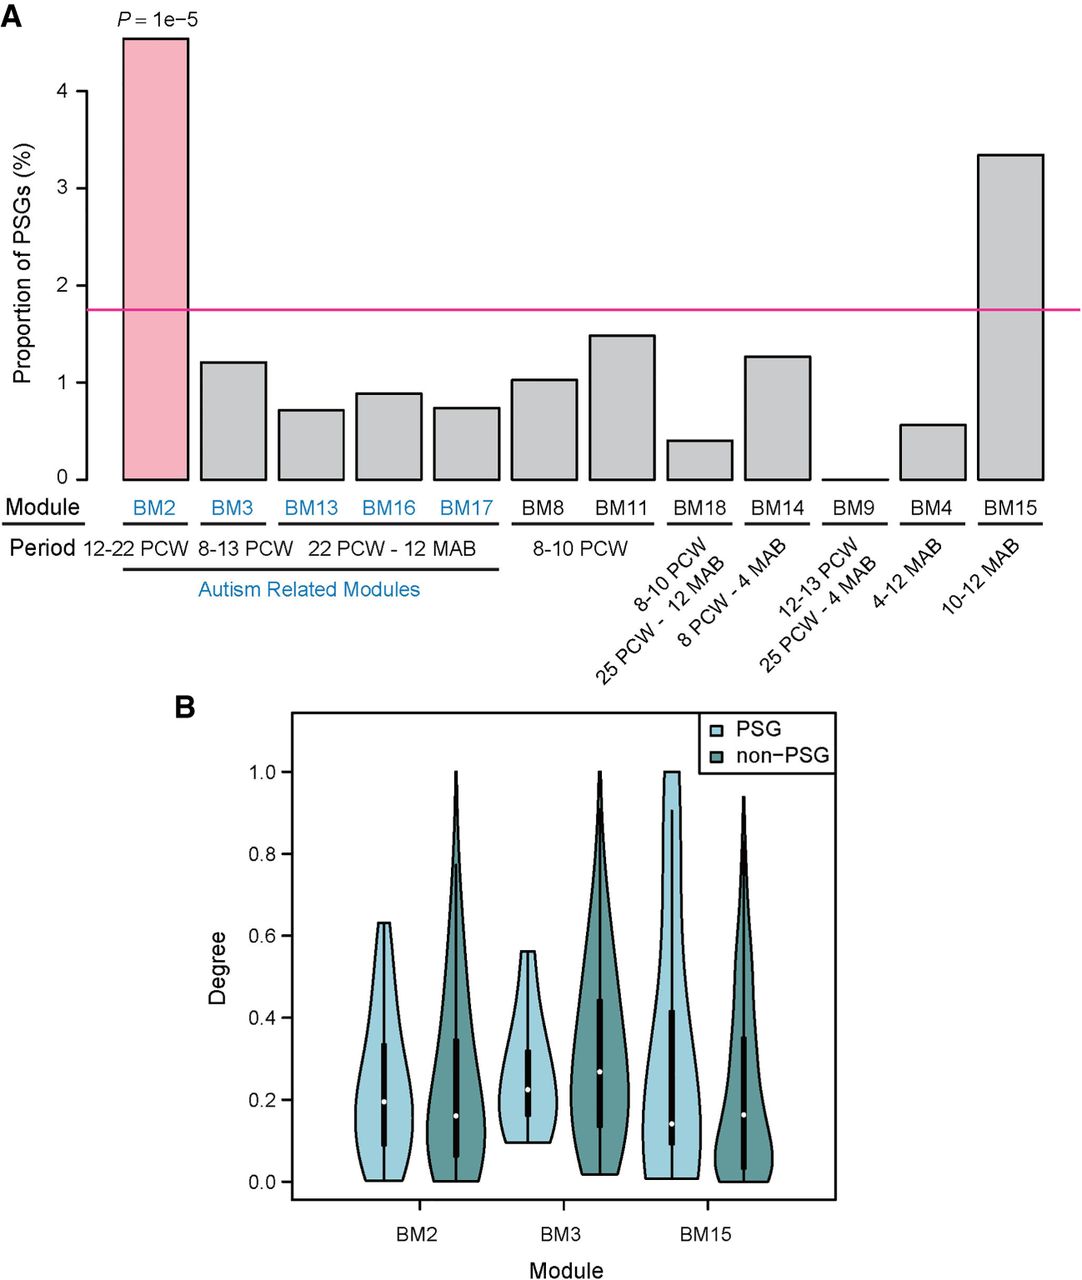
Percentage and connectivity of PSGs within each coexpression module generated based on brain developmental transcriptome. (A) Bar plot of PSG enrichment in precomputed modules (Parikshak et al. 2013). Notably, only a proportion of the 846 PSGs were included in the analyses (Parikshak et al. 2013). Below each module, the developmental period in which the genes are up-regulated is shown. PCW and MAB refer to “post conception weeks” and “months after birth,” respectively. For example, BM13, -16, and -17 show peak expression in the late fetal to early postnatal stage, with moderate differences in their temporal profiles (Parikshak et al. 2013). Autism-associated modules are masked in blue. Only BM2 shows significant enrichment of PSGs (indicated in light red) relative to the genome-wide percentage (pink horizontal line). (B) The distribution of connection degree within coexpression modules was shown separately for PSGs and non-PSGs as violin plots, where the black bar in the center indicates the interquartile range, the violin curve indicates the probability density of the data, and the white dot indicates the median. Only the three modules with more than 10 PSGs are shown here.


