
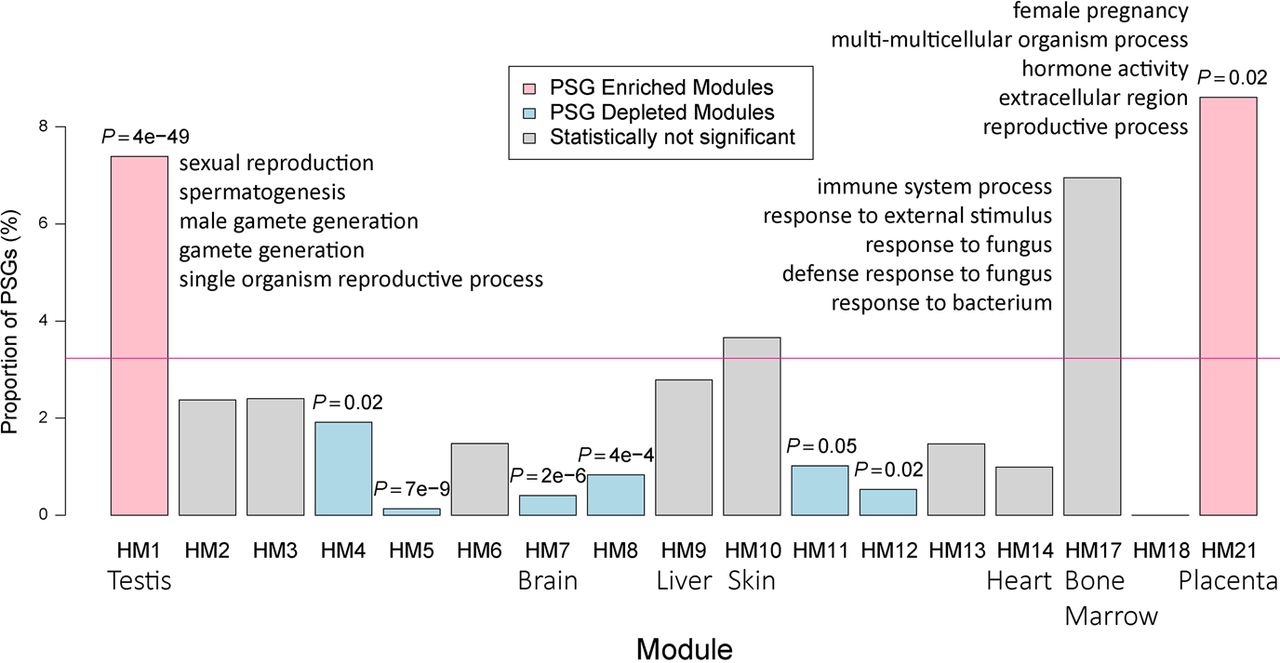
Percentage of PSGs within each coexpression module generated based on HPA adult tissue transcriptome. The genome-wide percentage of PSGs (3%) is indicated with a horizontal pink line, whereas modules exhibiting a significant excess or paucity (Bonferroni-corrected P < 0.05) of PSGs are indicated in light red and light blue, respectively. Nonsignificant categories are shown in gray. The corresponding multitesting adjusted P-values are marked above the boxes. The seven tissue-biased modules are labeled with their corresponding tissue names. For testis-biased, bone marrow–biased, and placenta-biased modules, the top five significantly enriched GO terms are shown.


