
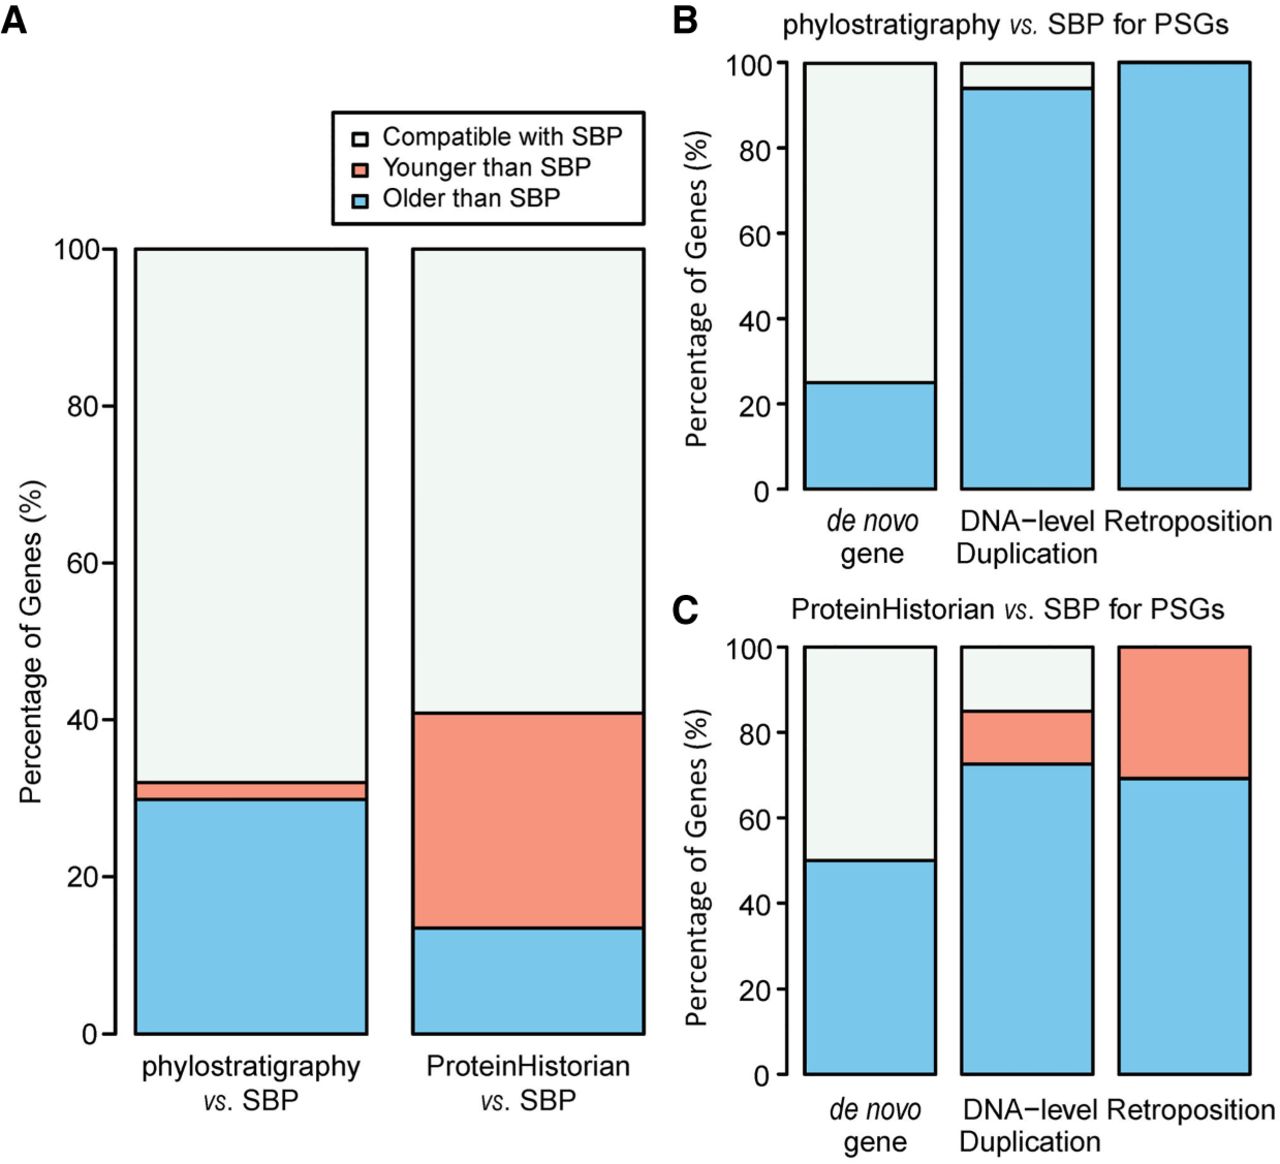
Figure 3.
Comparison of gene age estimates between SBP, phylostratigraphy, and ProteinHistorian. Panel A shows the statistics for all genes; panels B and C focus on SBP-dated PSGs and group them based on their origination mechanism.


