
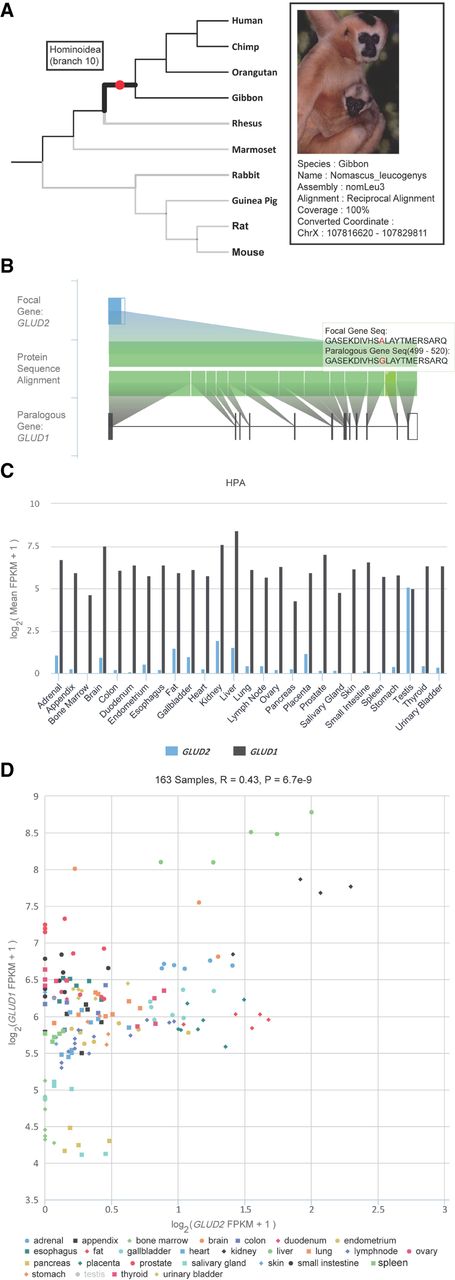
Representative sections in the gene page of GenTree database showing the evolutionary and functional features of GLUD2. (A) Branch view of GLUD2. When the mouse is placed over the branch on which GLUD2 originated, the top left tooltip shows the inferred age, that is, branch 10. For the external leaf node, the black line indicates the syntenic alignment, and the gray line indicates the nonsyntenic alignment. When the mouse is placed over an external node, that is, gibbon, the top right tooltip shows the alignment details in this species. Photo courtesy of Jim Zuckerman, Gibbon Conservation Center. (B) Paralogous alignment between GLUD2 and its parental gene, GLUD1. The top row shows the gene structure of GLUD2 with the open reading frame (ORF) indicated in a blue block and the untranslated region (UTR) indicated in an unfilled block. The gene structure of GLUD1 on the bottom is likewise indicated. The diagram in the center shows the protein alignment at the exon level, which is triggered by mouse-over. Mismatches are indicated in red. Users can zoom into a specific region of interest. (C) HPA transcriptome profile across tissues for the two paralogs. For each tissue, the mean expression across replicates is shown as the log2-transformed FPKM value. (D) Scatter plot view of expression intensity. Users can disable samples from some tissue (e.g., testis) and zoom into an area filled with data points of interest. Accordingly, the Pearson's correlation and P-value across the remaining samples (e.g., without testis) are recalculated automatically.


