
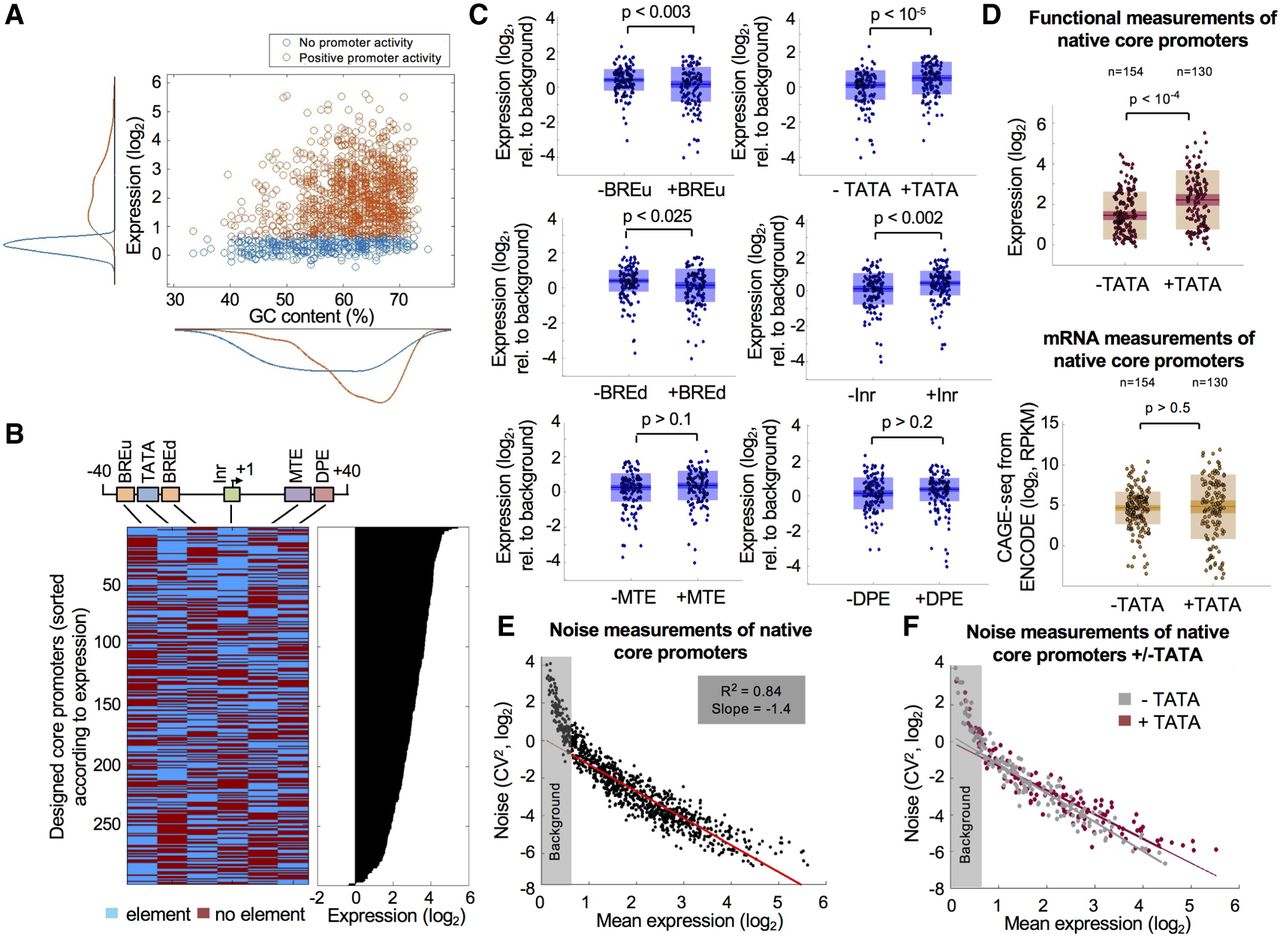
Systematic investigation of core promoter elements in synthetic configurations and native core promoters from the human genome. (A) The relationship between GC content and promoter activity in 1875 native core promoters from the human genome. (Cyan) Sequences with no promoter activity as defined by empty vector measurements; (orange) sequences with positive promoter activity. (B) Three hundred twenty synthetic oligos representing all possible combination of six core promoter elements on five different backgrounds were designed. Each line in the heatmap (left) represents a single designed oligo, and each column represents one of the six elements tested. The configurations were sorted according to the expression measurements (right). (C) Comparison between the expression of all the designed sequences with and without each of the six core promoter elements. Each measurement was normalized by the expression levels of the matching background sequence. Wilcoxon rank-sum tests were performed to determine significant differences in expression, and P-values are denoted. (D) The effect of TATA-box in native human core promoters. (Top) Expression measurements from our functional assay of native core promoters from the human genome with and without a consensus TATA-box. Elevated expression is observed in promoters with TATA element (P < 10−4, two-sample t-test). (Bottom) CAGE-seq measurements in K562 cells for the same promoters from ENCODE (The ENCODE Project Consortium 2012). No significant difference was detected between the two groups (P > 0.5, two-sample t-test). (E) Noise measurements of 990 native core promoters from the human genome as a function of mean expression. A linear fit was performed on oligos with positive core promoter activity as described before (Bar-Even et al. 2006). (F) Comparison of noise measurements of native core promoters with and without a TATA-box.


