
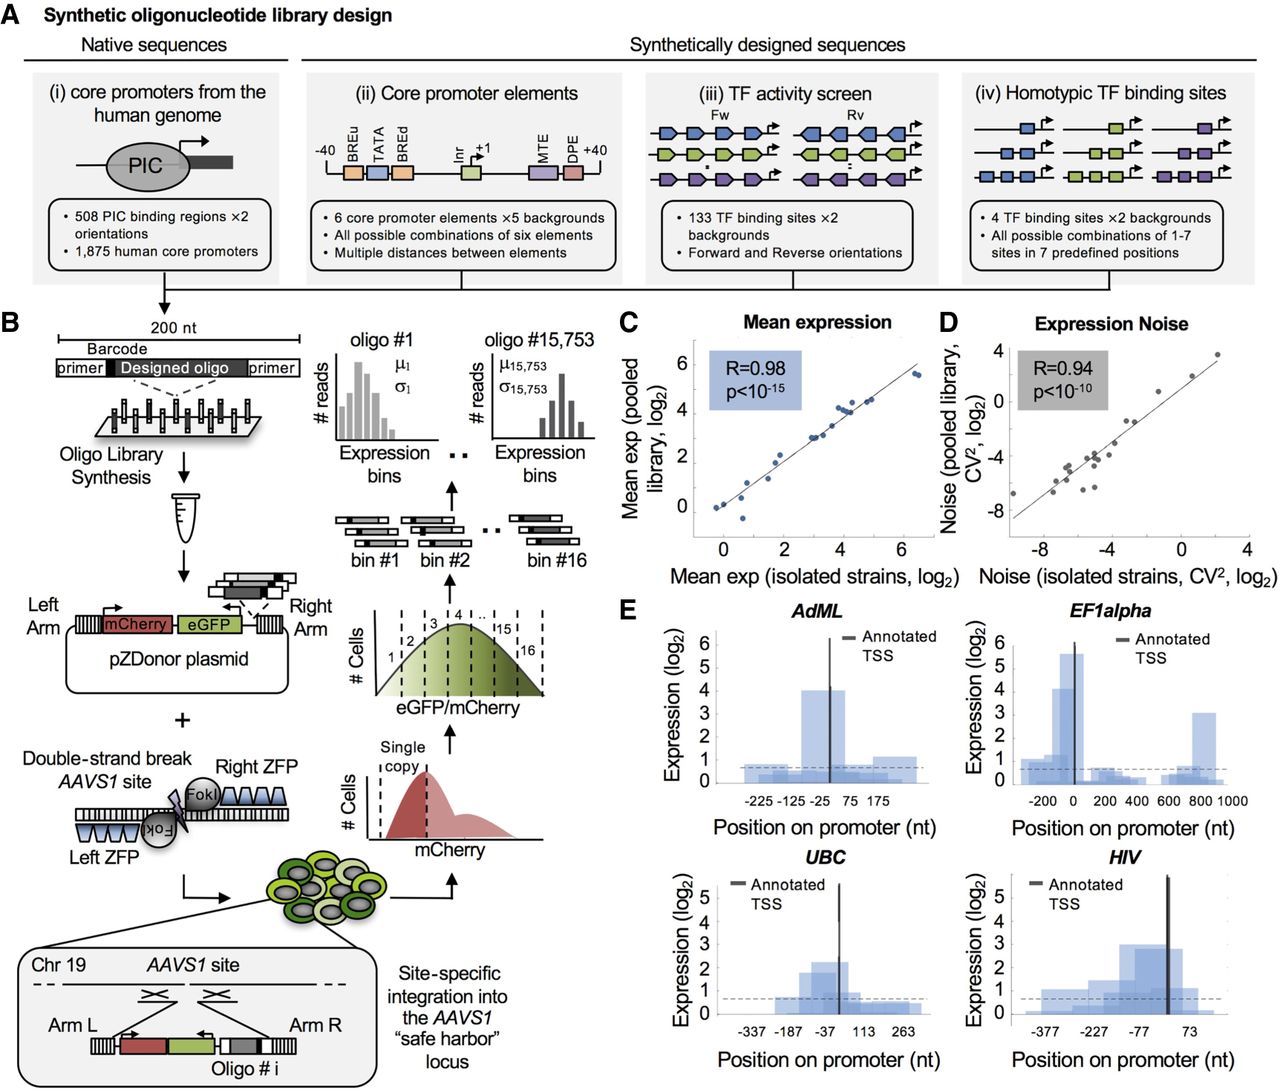
Construction and measurements of 15,753 designed oligonucleotides for promoter activity using site-specific integration technology. (A) Illustration of the design of the main sets composing the synthetic library. (B) We synthesized 15,753 designed ssDNA oligos 200 nt in length on Agilent programmable arrays and harvested them as a single pool. Oligos were amplified by PCR using constant primers and cloned into pZDonor plasmid upstream of eGFP. The plasmid pool was conucleofected with mRNAs encoding zinc finger nucleases (ZFNs) targeting the AAVS1 site into a modified K562 cell line containing only two (of three) copies of the AAVS1 site (see Methods). mCherry expression driven from a constitutive EF1alpha promoter was used to select cells with a single integration by FACS. Cells were then sorted into 16 bins according to eGFP/mCherry ratio. Oligos were amplified from each bin and submitted for deep sequencing. Finally, the distribution among expression bins was determined for each oligo, and mean expression and noise were computed. (CV) Coefficient of variation. (C,D) Accuracy of expression measurements. Twenty-one clones, each expressing a single oligo, were isolated from the library pool and identified by Sanger sequencing. eGFP/mCherry ratio was measured for each clone individually by flow cytometry. Shown are comparisons between these isolated measurements and those calculated from the pooled expression measurements for mean expression (C; R = 0.98, Pearson's correlation, P < 10−15) and noise (D; R = 0.94, Pearson's correlation, P < 10−10). (E) Detection of autonomous core promoter activity. Sequences of four full-length promoters were partitioned in-silico into 153-nt fragments with a large overlap of 103 nt between oligos. The positions of the annotated transcription start sites (TSSs) from the literature are denoted, and the positions on the x-axis are relative to the TSSs. Dashed lines represent the activity threshold determined by the empty vector measurements (Methods).


