
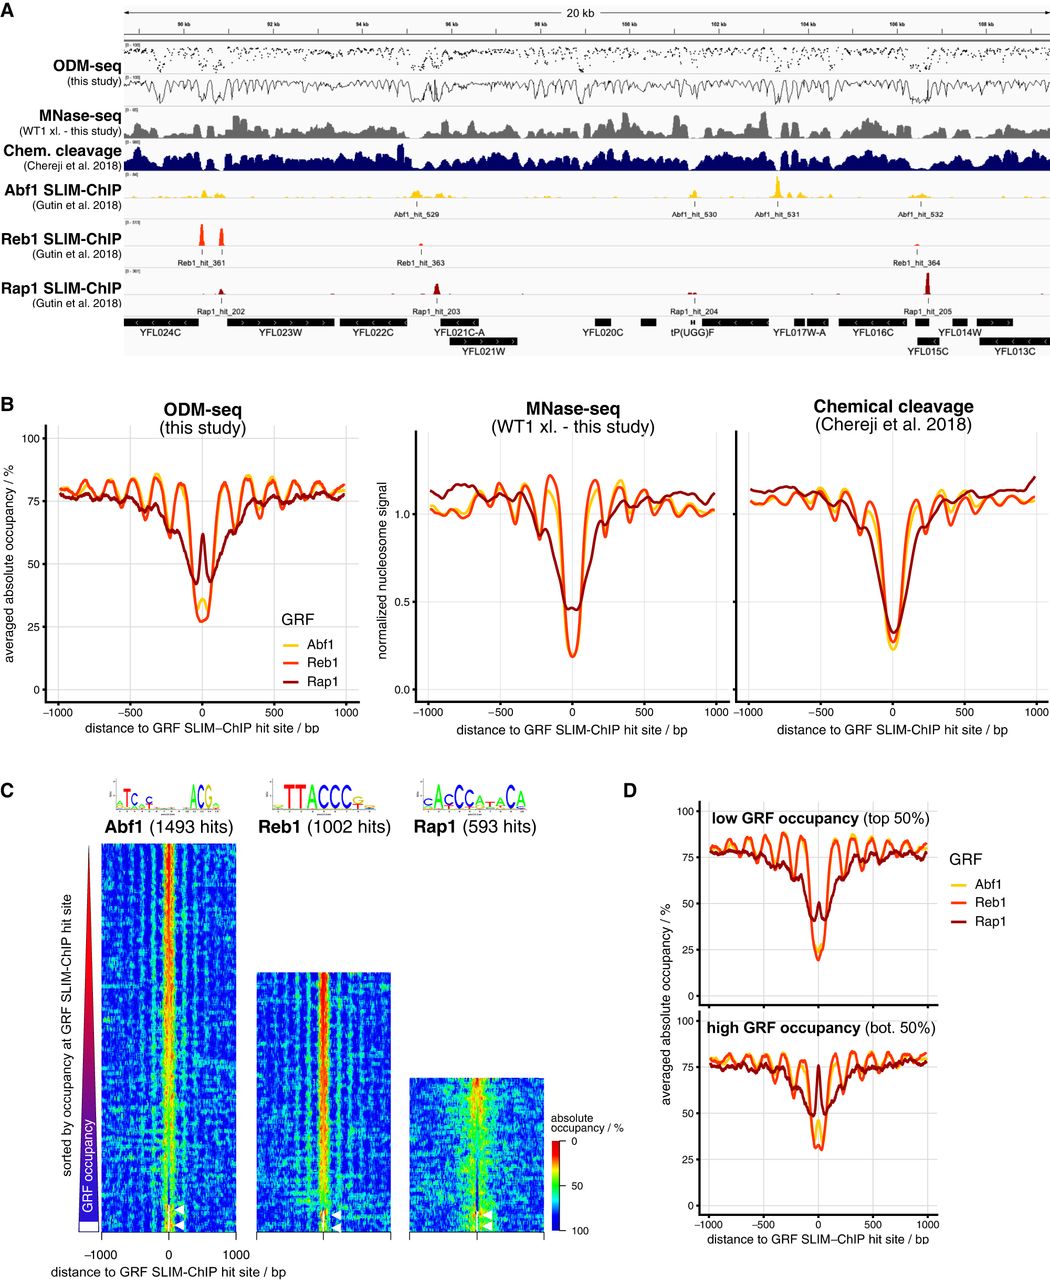
ODM-seq monitors not only absolute nucleosome but also absolute GRF occupancy. (A) IGV browser shot comparison of the indicated data sets (Supplemental Table S2). ODM-seq data are given both as individual (top) and as connected data points (second from top). (B) GRF site-aligned composite plots of absolute occupancy (left) or normalized signal (center and right) for the indicated GRFs and data sets. Signals are normalized to a mean of one. (C) GRF site-aligned heat maps of absolute occupancy sorted from top to bottom according to increasing absolute occupancy at GRF sites. The position weight matrix (Badis et al. 2008) and the number of binding sites detected by SLIM-ChIP for the indicated GRFs is given above the heat maps. White color denotes absence of signal (highlighted by white arrows). (D) As in B, left graph, but for genes of low and high GRF occupancy according to the SLIM-ChIP sorting in C.


