
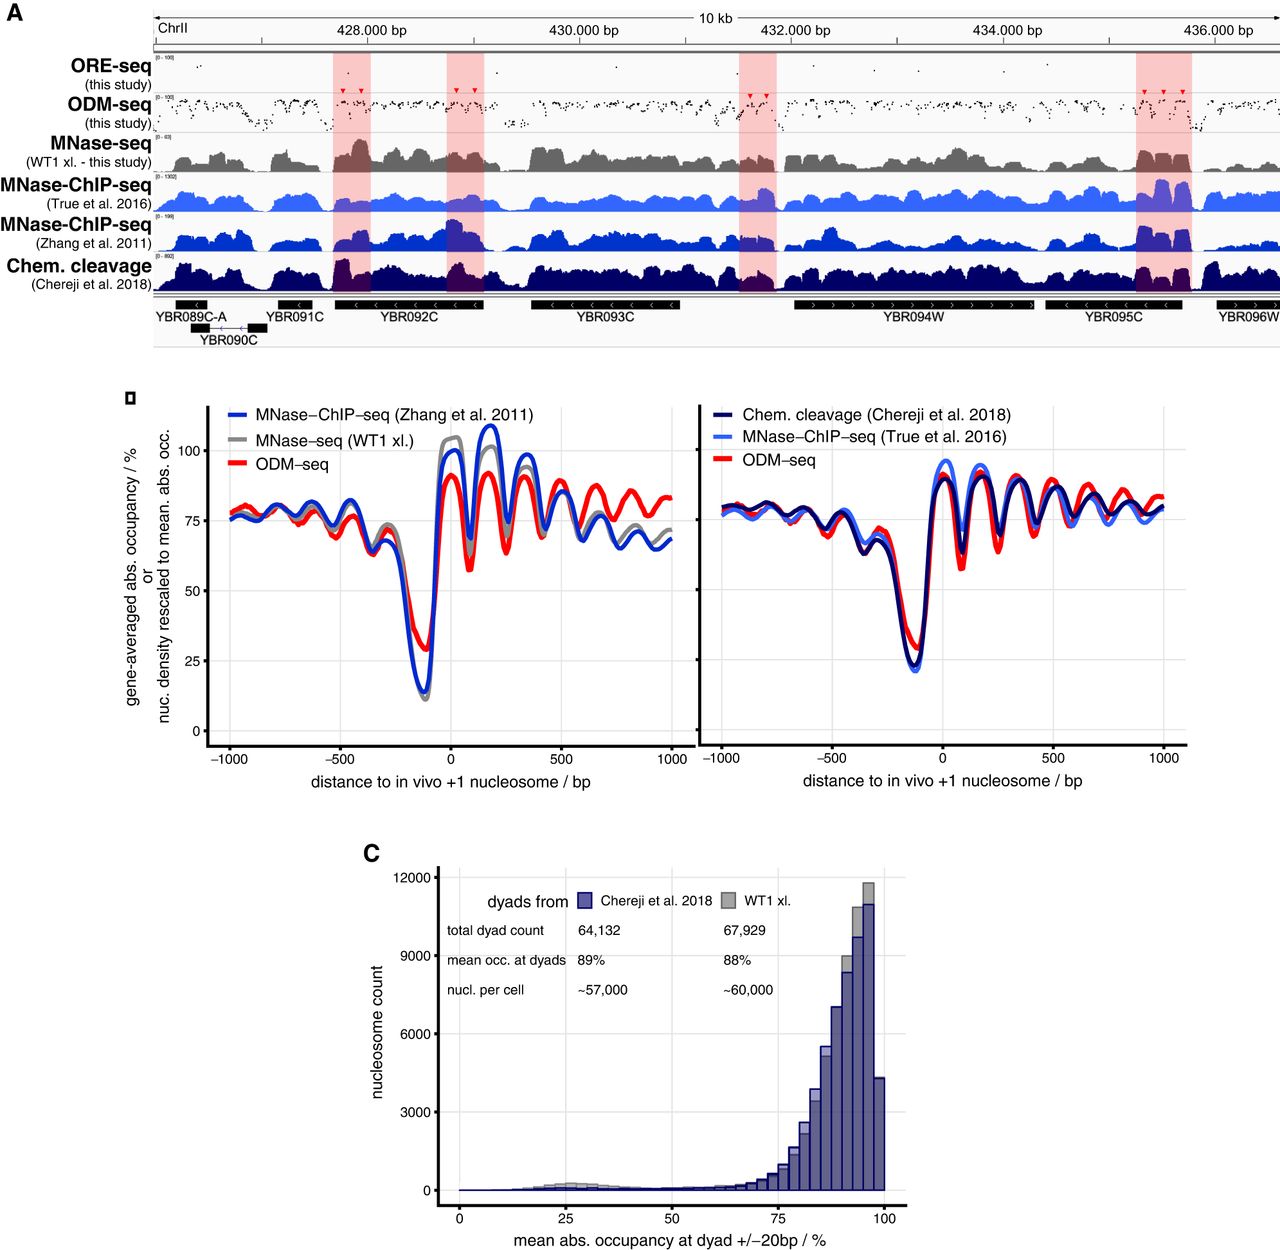
The ODM-seq absolute occupancy map. (A) Integrated Genome Viewer (IGV) browser shots comparing the indicated data sets (Supplemental Table S2) with our ORE-seq and ODM-seq absolute occupancy data. Regions in light red highlight pronounced differences in occupancy/signal between methods. (B) As in Figure 1C but for the indicated data sets. Because the external data do not provide absolute occupancy, we globally rescaled their signal to have the same genomic mean as the absolute occupancy map. Here and in following cases, nucleosome dyads of external data sets were extended to 147 bp. (C) Histogram of absolute occupancy at nucleosome positions called from the indicated data sets.


