
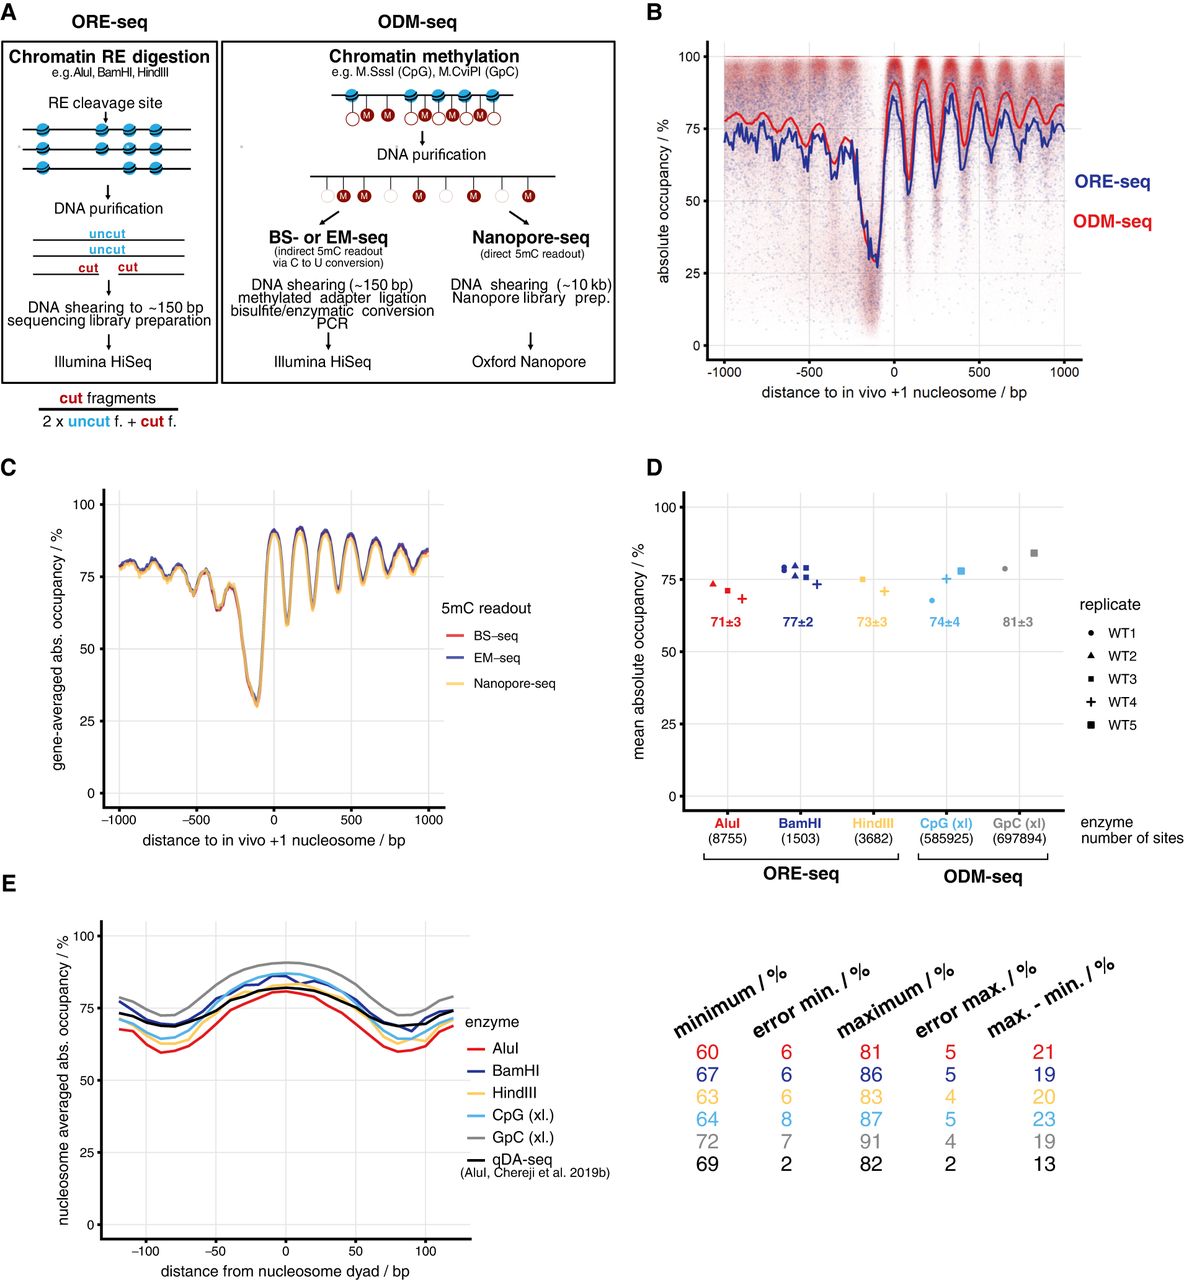
Genome-wide absolute occupancy measurement by restriction enzymes and DNA methyltransferases. (A) Method overview; for details, see text. Lollipops stand for DNA methylation sites: (open) unmethylated; (red fill “M”) methylated; (f.) fragments. (B) Composite plot of absolute occupancy ORE-seq and ODM-seq data averaged over all included samples and aligned at in vivo +1 nucleosome positions. Each dot represents the value of one genomic site, and the lines show the 10-bp bin mean occupancy of aligned sites. (C) As in B, but for WT5 replicate and the different 5mC readouts stated in A. (D) Absolute occupancy averaged over all sites (mean absolute occupancy) obtained by ORE-seq (Supplemental Table S3) or ODM-seq (Supplemental Table S4) for the indicated enzymes and biological replicates (WT1 to WT5) at saturation conditions. The number of sites implemented for each enzyme is indicated. (xl.) in vivo formaldehyde cross-linked. (E) Absolute occupancy values averaged in 10-bp bins around nucleosome dyads called from chemical cleavage-seq data (Chereji et al. 2018) and averaged over all replicates for the indicated enzymes. qDA-seq data are taken from Chereji et al. (2019b). On the right, absolute occupancy values and errors (mean over sites in the bin of the standard deviation among samples) are shown for the maxima and minima of each plot as well as the difference between maximum and minimum values for each enzyme.


