
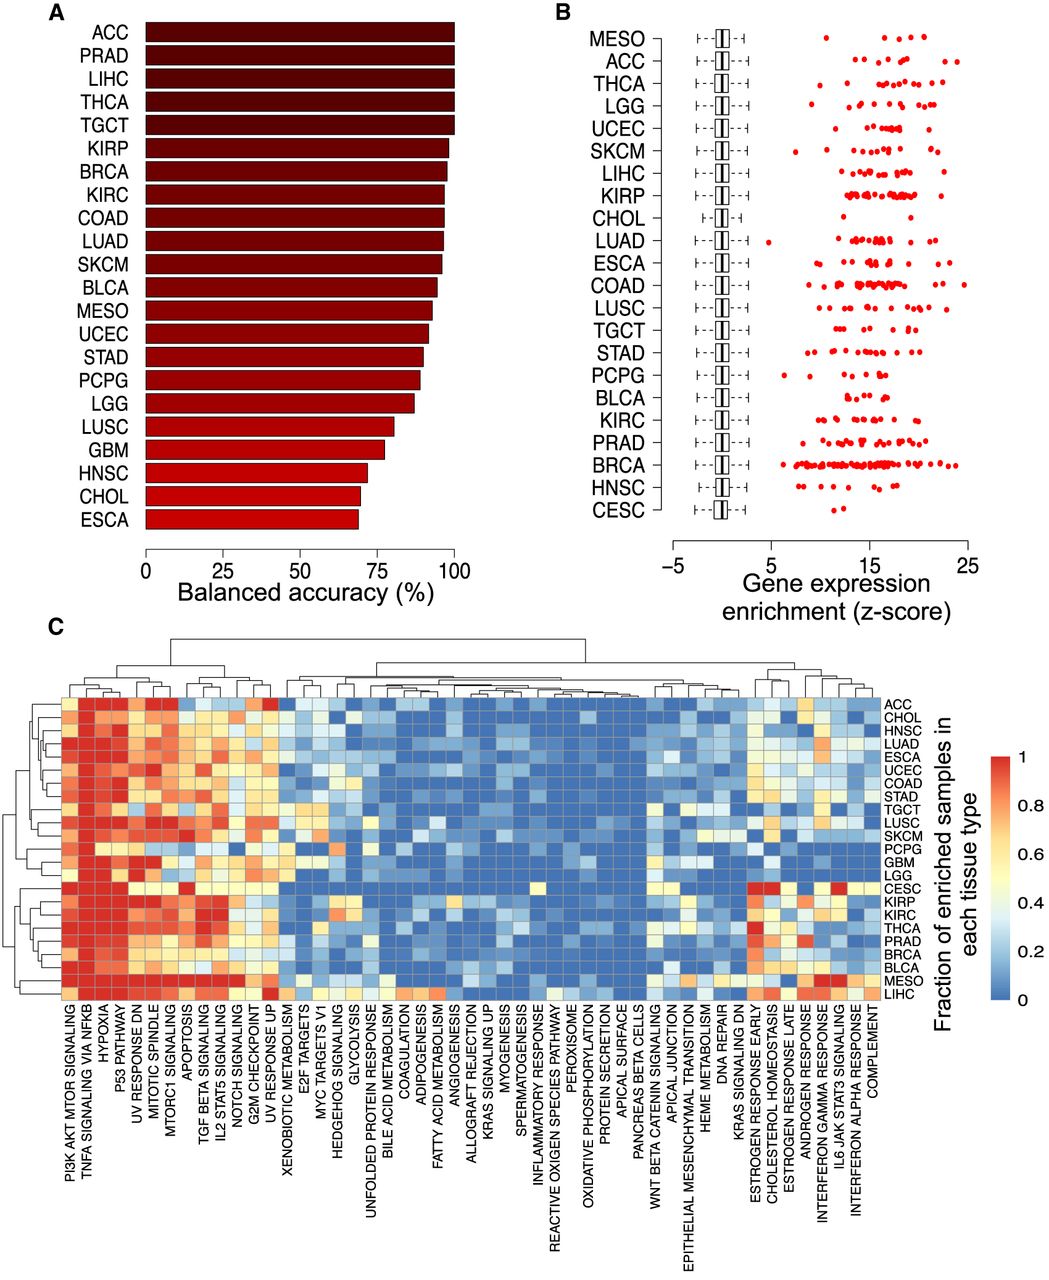
Biology of COREs in human tumor samples. (A) Balanced accuracy for classification of TCGA tumor samples based on their tissue of origin using CREAM-identified COREs. (B) Enrichment of highly expressed genes in proximity (±10 kb) of CREAM-identified COREs versus individual CREs for TCGA tumor samples. Boxplots show the null distribution corresponding to expression of randomly selected genes, and each dot corresponds to the expression of proximal genes to COREs for each tumor sample in TCGA. (C) Enrichment of hallmark gene sets relying on genes in proximity (±10 kb) of COREs versus genes in proximity (±10 kb) of individual CREs for TCGA tumor samples.


