
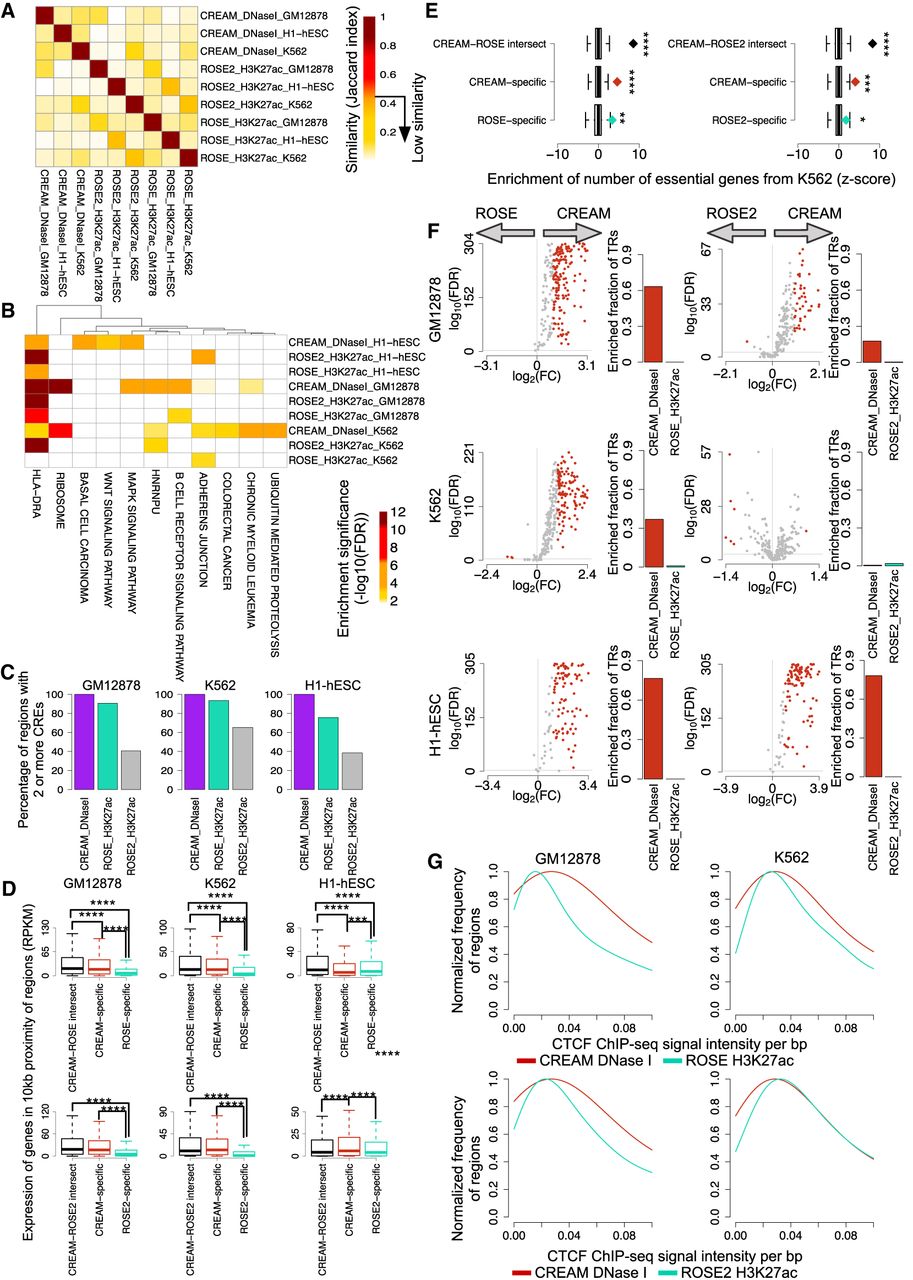
Comparison of CREAM-identified COREs and super-enhancers of the GM12878, K562, and H1-hESC cell lines. (A) Similarity of COREs and super-enhancers based on their genomic loci overlap. (B) Top five enriched biological pathways using genes in 10-kb proximity of the identified COREs and super-enhancers in each one of the GM12878, K562, and H1-hESC cell lines. (C) Percentage of COREs and super-enhancers containing two or more individual CREs. (D) Expression of genes in 10-kb proximity of both COREs and super-enhancers or exclusively in proximity of COREs or super-enhancers. (E) Enrichment of essential genes among genes in proximity of both COREs and super-enhancers or exclusively in proximity of COREs or super-enhancers. (F) Enrichment of TR binding intensity from ChIP-seq data in COREs identified by CREAM versus super-enhancers. Volcano plots represent −log10(FDR) versus log2(FC) in ChIP-seq signal intensities. Each dot is one TR (colored indicates significant FC; gray, insignificant FC). The barplots show how many TRs have higher signal intensity in COREs or super-enhancers (FDR < 0.001 and log2[FC] > 1). FC is defined as the ratio between the average signal per base pair in COREs versus super-enhancers. (G) Distribution of ChIP-seq signal intensity of CTCF at COREs and super-enhancers in 10-kb proximity of TAD boundaries.


