
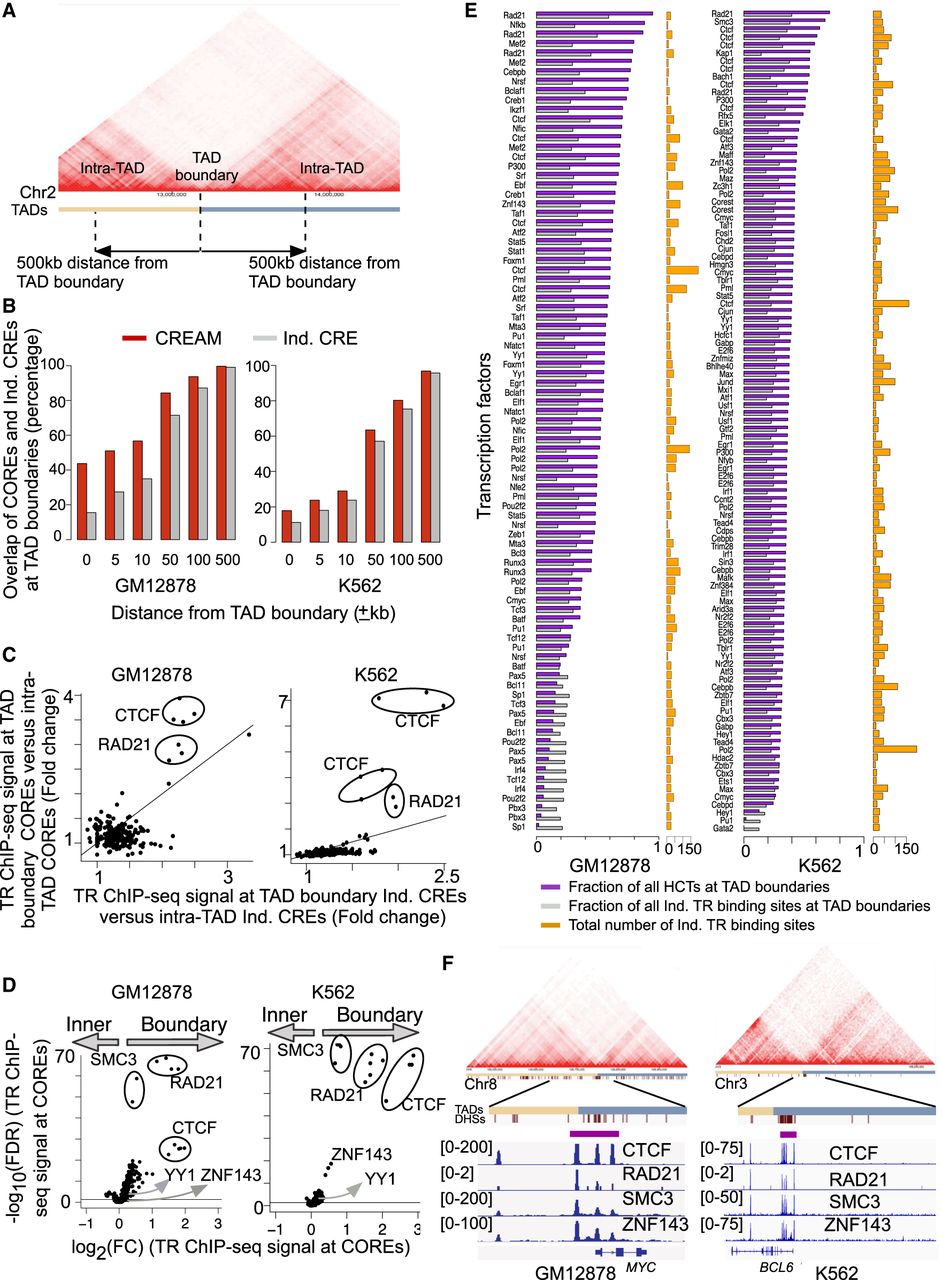
Arrangement of COREs and individual CREs with respect to TAD boundaries. (A) Schematic representation of TAD boundaries and intra-TAD regions (25-kb Hi-C resolution). (B) Comparison of fraction of COREs and individual CREs from DNase-seq that lie at TAD boundaries with increasing distance from TAD-boundary cutoffs in the GM12878 and K562 cell lines. (C) Enrichment of TR binding intensities within COREs over individual CREs that lie in proximity of TAD boundaries (±10 kb) versus COREs and CREs farther away from TAD boundaries (intra-TAD elements) in the GM12878 or K562 cell line. (D) Enrichment of TR binding intensity in COREs proximal to TAD boundaries (±10 kb) versus intra-TAD domains. (E) Fraction of HCTs (purple) and individual TR binding regions (gray) at TAD boundaries (±10 kb). The total number of individual binding regions for each TR in the GM12878 and K562 cell lines is also reported (orange). (F) Examples of HCTs for CTCF, RAD21, SMC3, and ZNF143 at the TAD boundary for the MYC and BCL6 genes (10-kb Hi-C resolution).


