
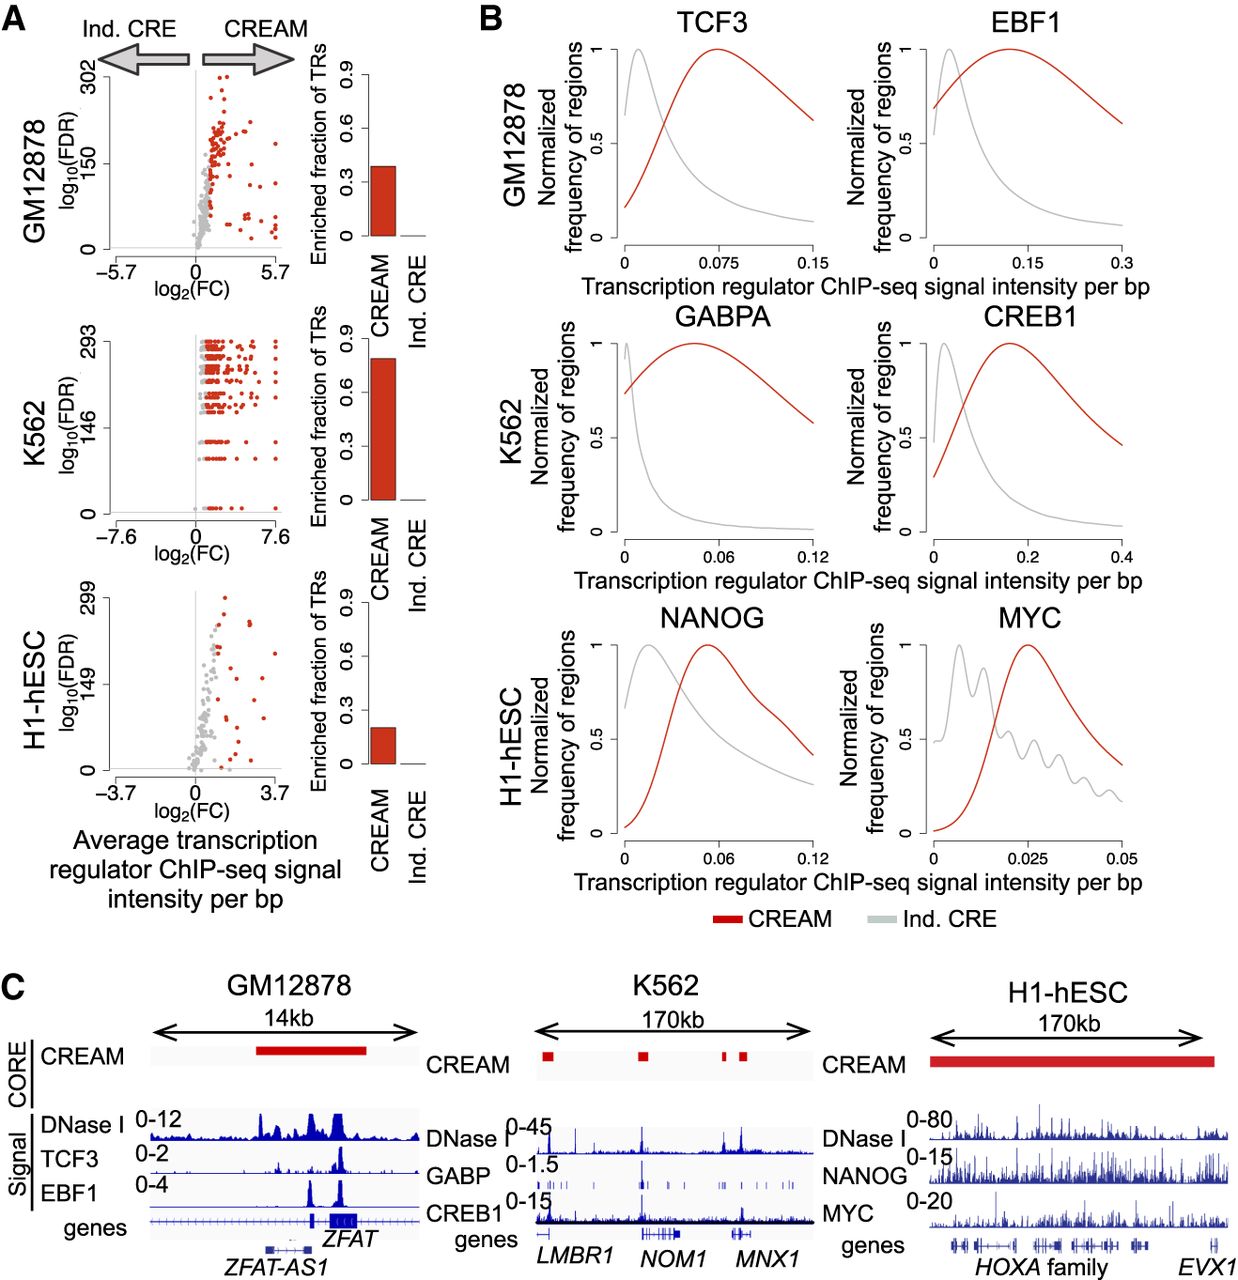
Transcription regulator (TR) binding intensity in individual CREs and COREs. (A) Enrichment of TR binding intensity from ChIP-seq data in COREs identified by CREAM versus individual CREs from DNase-seq in the GM12878, K562, or H1-hESC cell lines. Volcano plots represent −log10(FDR) versus log2(fold change [FC]) in ChIP-seq signal intensities. Each dot is one TR (colored indicates significant FC; gray, insignificant FC). The barplots show how many TRs have higher signal intensity in COREs or individual CREs (FDR < 0.001 and log2[FC] > 1). FC is defined as the ratio between the average signal per base pair in COREs versus individual CREs. (B) Distribution of ChIP-seq signal intensity at COREs and individual CREs for TCF3 and EBF1 as examples of master TRs in GM12878, for GABPA and CREB1 as examples of master TRs in the K562 cell line, and for NANOG and MYC as examples of master TRs in the H1-hESC cell line. (C) Examples of genomic regions with COREs (with different coverage) occupied by TRs presented in B.


