
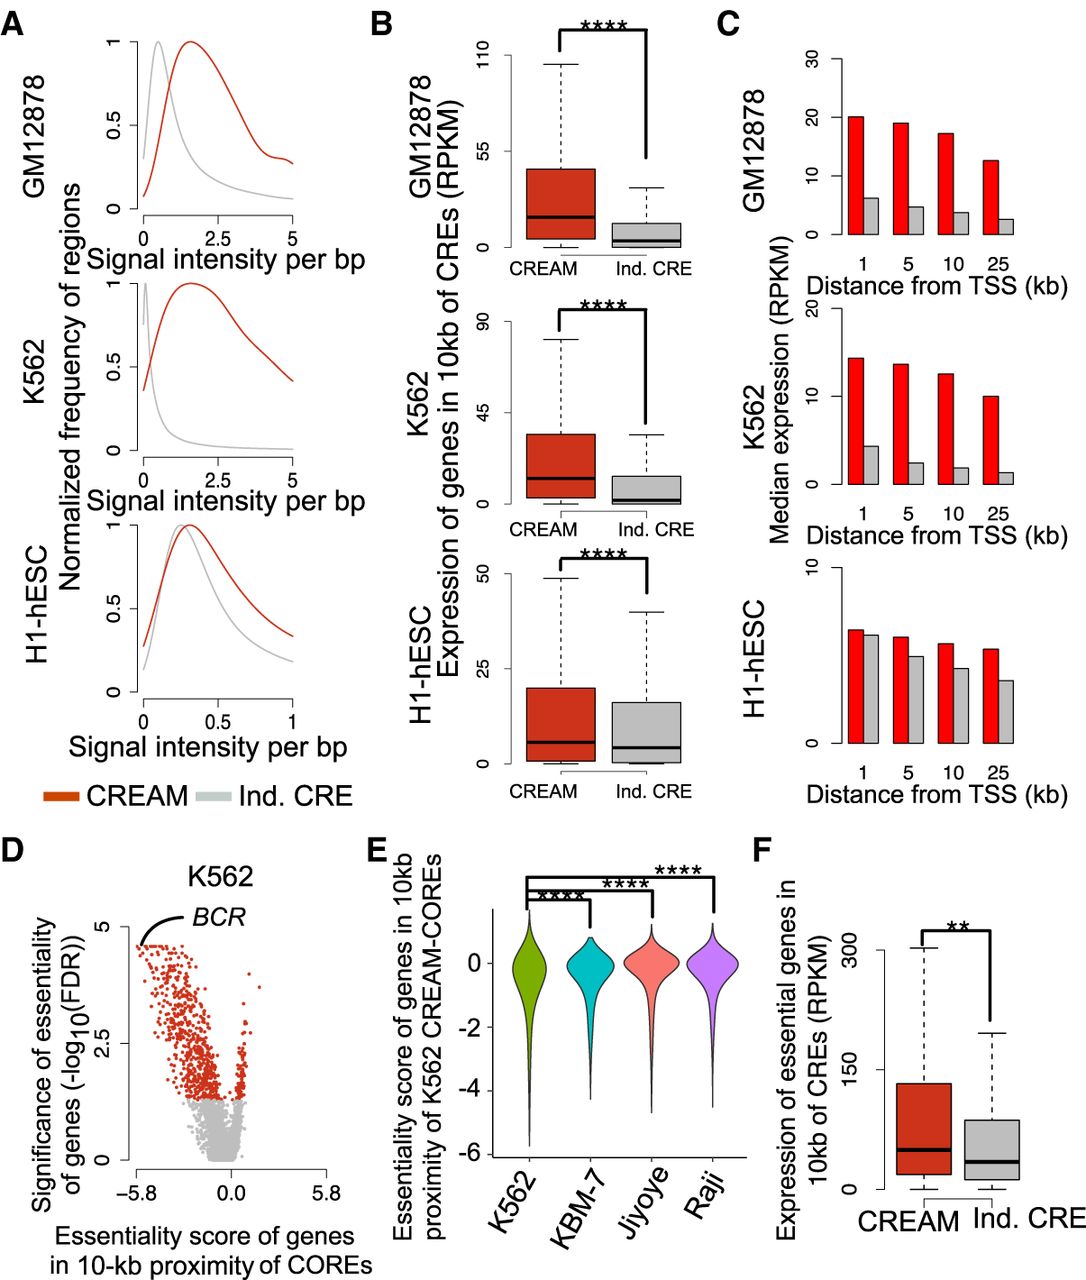
Comparison of genomic characteristics of the COREs identified by CREAM versus individual CREs in the GM12878, K562, and H1-hESC cell lines. (A) Distribution of DNase I signal intensity in individual CREs and COREs (signal per base pair). (B) Expression level of genes in 10-kb proximity of individual CREs or COREs. (****) P-value <0.0001. (C) Median expression of genes according to distance to the closest individual CRE (gray) or CORE (red). (D) Volcano plot of significance (FDR) and effect size (essentiality score) of genes in proximity of CREAM-identified COREs in the K562 cell line (red indicates significant fold change; gray, insignificant fold change). (E) Essentiality score from K562, KBM-7, Jiyoye, and Raji cell lines for genes proximal (±10 kb) to COREs identified by CREAM in the K562 cell line. (****) P-value <0.0001 using Wilcoxon signed-rank test. (F) Expression level of essential genes associated with individual CREs versus COREs. (**) P-value <0.01.


