
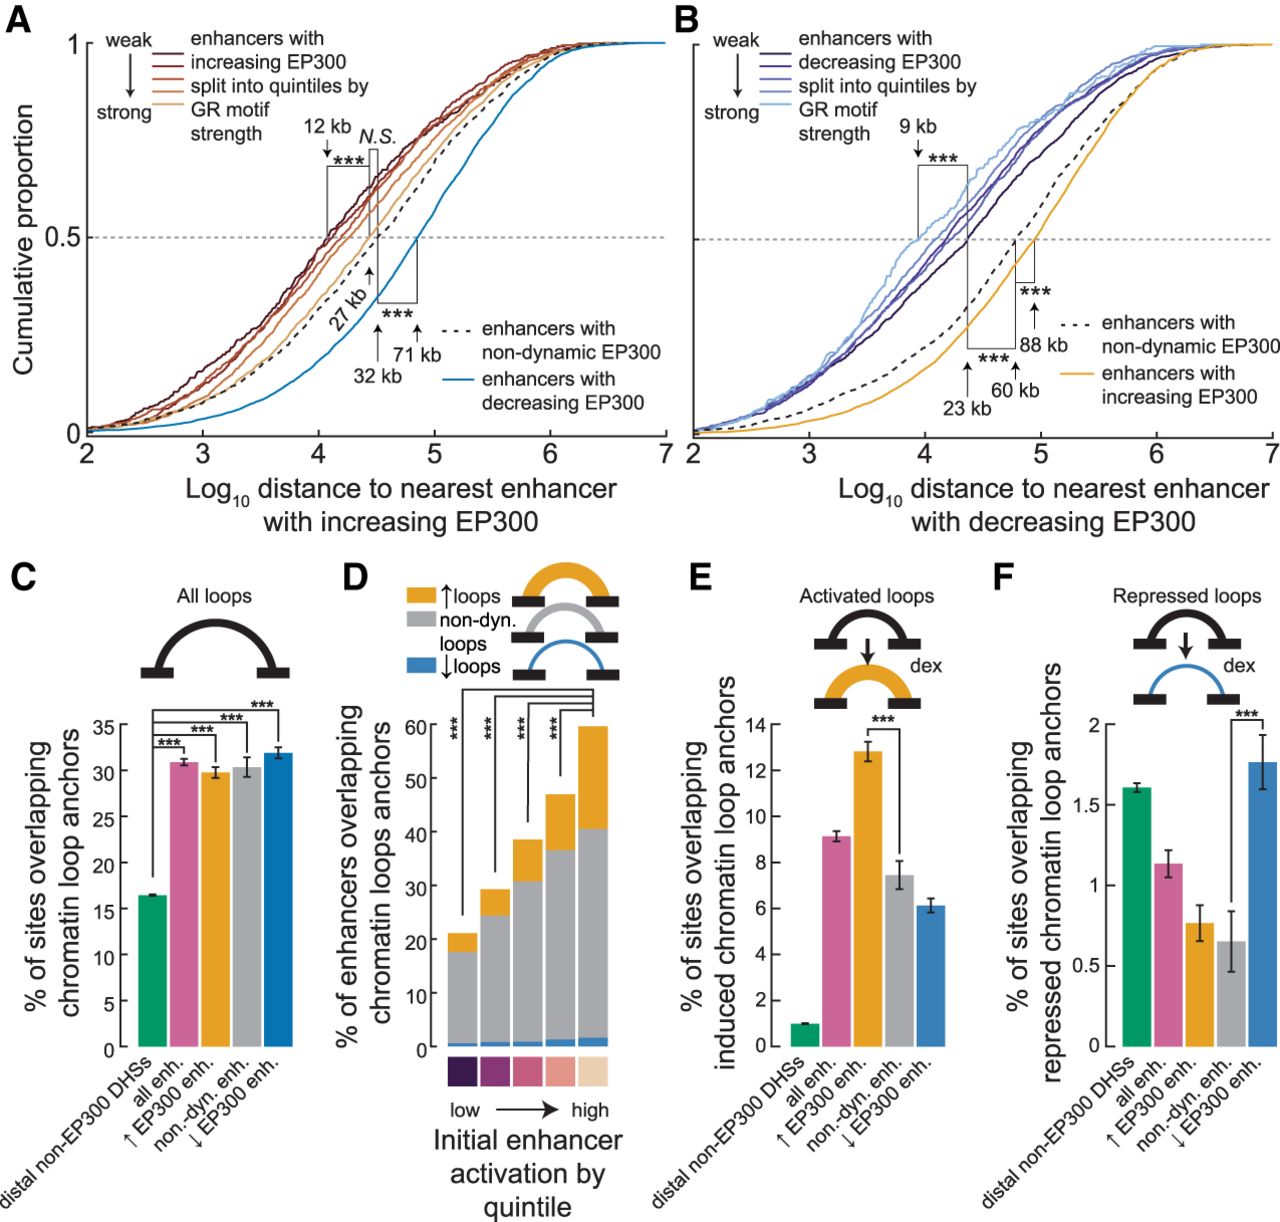
Enhancer dynamics are dependent across neighboring enhancers and coordinated by chromatin looping. (A) Cumulative distribution of distance to nearest neighboring enhancer with increased EP300 by EP300 dynamics class, where enhancers with increased EP300 were additionally split into quintiles by GR motif strength. (***) P < 0.001; N.S. = P > 0.01. (B) Cumulative distribution of distance to nearest neighboring enhancer with decreased EP300 by EP300 dynamics class, where enhancers with decreased EP300 were additionally split into quintiles by GR motif strength. (***) P < 0.001. (C) Barplot shows the percentage of sets of sites that overlap with chromatin loop anchors. Error bars, SE of percentage computed from the normal approximation of a binomial proportion. (***) P < 0.001. (D) Same as C, except with a specific focus on enhancers, which were split by initial enhancer activation as estimated by the principal component decomposition of flanking H3K4me1 and H3K27ac occupancy. (E) Same as C, except only anchors of induced loops considered. (F) Same as C, except only anchors of repressed loops considered.


