
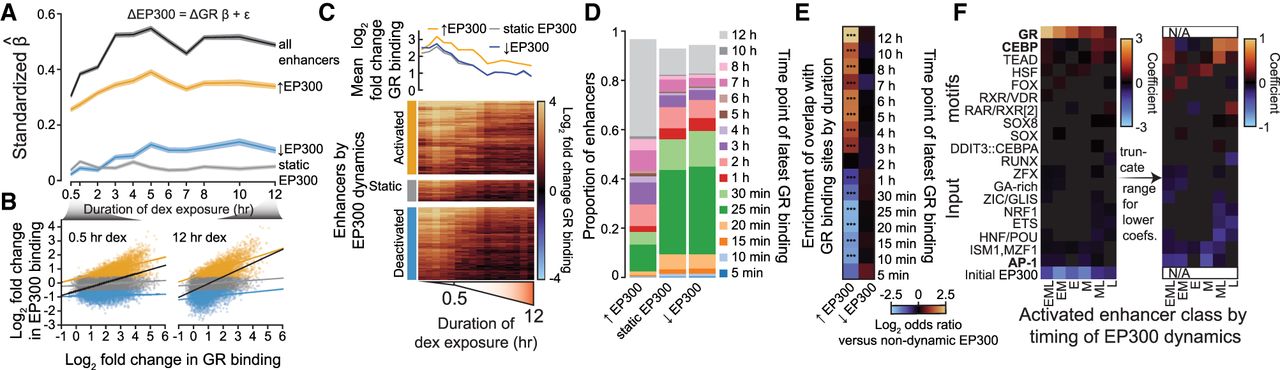
Direct GR binding drives changes in EP300 binding in enhancers. (A) Lineplot displays estimated coefficients in regression of change in EP300 binding on change in GR binding in enhancers. Either all enhancers were used to fit model (black) or subsets of enhancers based on EP300 dynamics, which are displayed as indicated. Standard errors of coefficients shown as semitransparent ribbon. (B) Scatter plots compare log2 fold change in GR binding and in EP300 binding in enhancers at 0.5 and 12 h of dex exposure. Separate regression lines are shown with 95% confidence bands for each enhancer class indicated in A. (C) Heatmap shows the log2 fold change in GR binding in enhancers with increased, nondynamic, and decreased EP300 hierarchically clustered by complete linkage and sorted in descending order by change in binding (below). Discontinuity in x-axis label indicates where sampling frequency shifts from every 5 min to approximately every hour. Line plot shows mean across all enhancers by dynamics class (above). (D) Bar plot displays the proportion of enhancers, by EP300 dynamics class, that overlaps GR binding sites by the last time point at which GR was observed to bind above background. (E) Heatmap shows the log2 odds ratio of enrichment of overlap to the GR binding site sets in D for enhancers with dynamic EP300 versus enhancers with nondynamic EP300. (F) Heatmap shows elastic net logistic regression coefficients for RSAT-clustered JASPAR TF motifs with nonzero coefficients in the prediction of gains in EP300 by dynamic class. Each column represents results from an independent model where enhancer sets were split by time of increased EP300 binding as in Supplemental Figure S4B and the background set was all enhancers with decreased or nondynamic EP300.


