
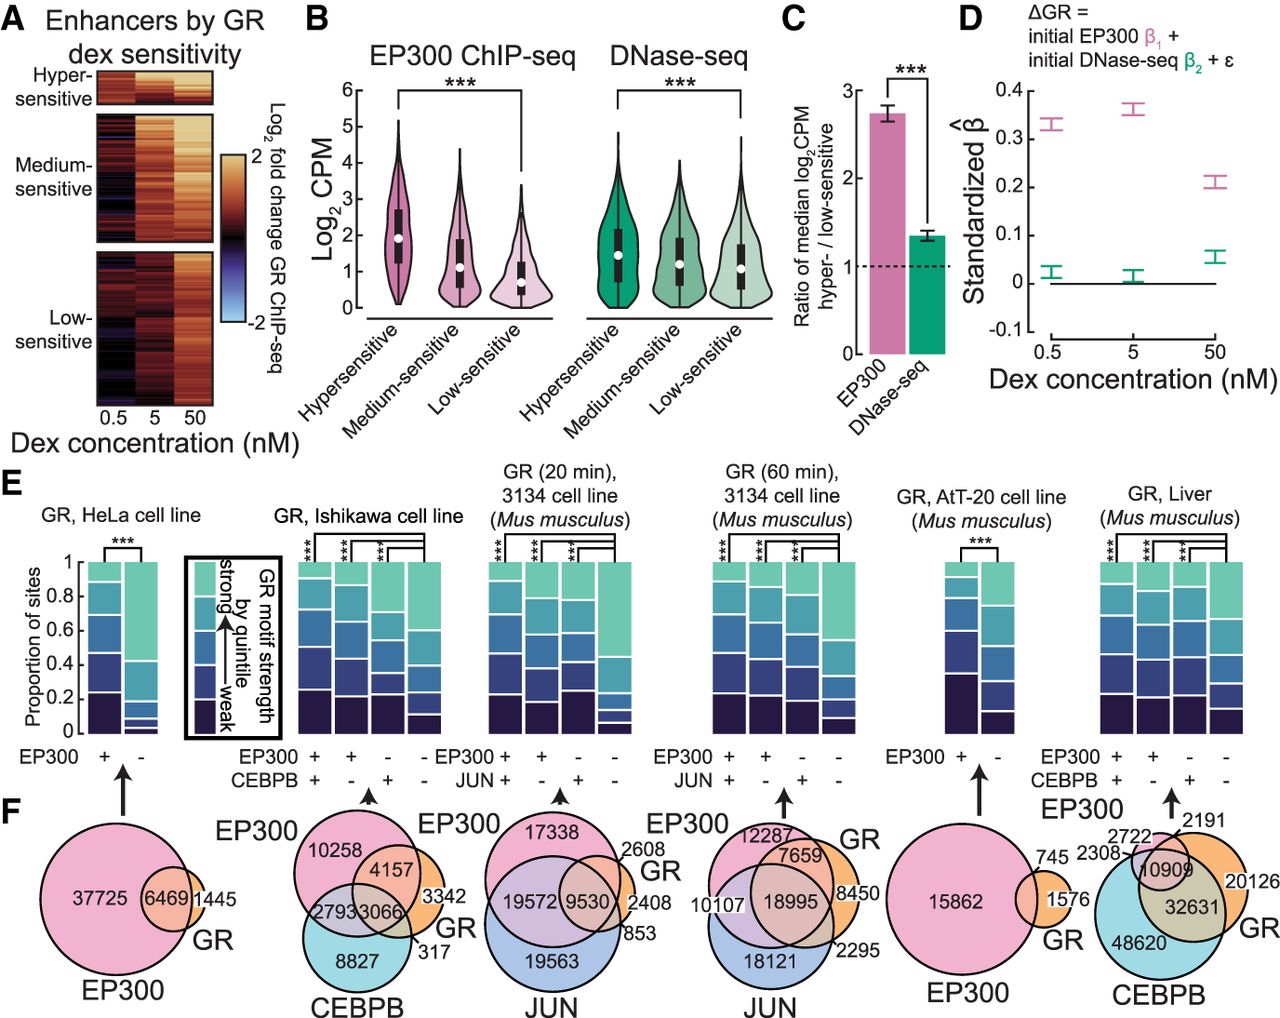
GR binds to enhancers across cellular contexts. (A) Change in GR binding shown for three classes of enhancers defined by GR binding responsiveness to varying dex concentrations. (B) Initial abundance of EP300 ChIP-seq (left) and DNase-seq (right) in enhancers by classes in A. Abundance in log2 counts per million (log2 CPM). (***) P < 0.001. (C) Ratio of log2 CPM EP300 ChIP-seq and DNase-seq in dex hypersensitive versus low-sensitive sites. (***) P < 0.001. (D) Estimated coefficients of a series of linear models regressing change in GR binding by dex concentration on initial EP300 ChIP-seq abundance and initial DNase-seq abundance after standardizing all variables (equation shown above). (E) Sets of GR binding sites across a variety of cellular contexts were split into quintiles by GR motif strength. Bar plots show the proportions of GR sites by intersection with EP300 sites and selected TF sites that fall within each quintile. (***) P < 0.001. (F) Venn diagrams show overlap of GR binding sites with EP300 sites and selected TF sites across a variety of cellular contexts corresponding to E.


