
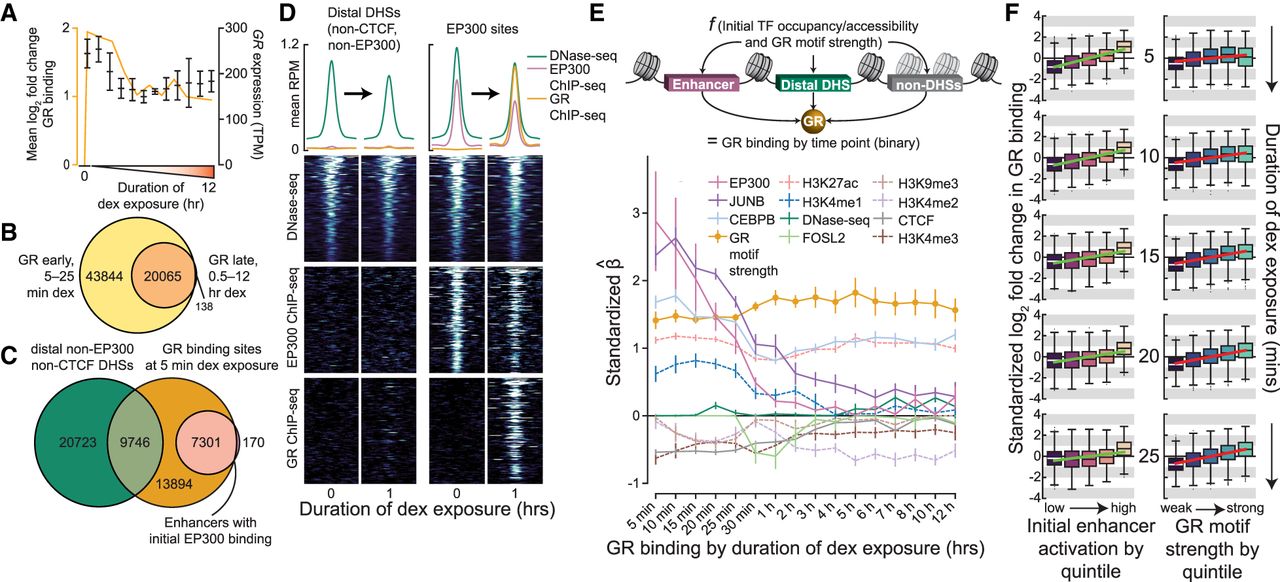
Chromatin accessibility does not predetermine GR binding. (A) Line plot shows mean log2 fold change in GR binding in enhancers over time course (orange) as well as the expression of GR over the time course (black) as assayed by RNA-seq, quantified at the gene-level, and measured in transcripts per million (TPM). Error bars, SD across replicates. (B) Venn diagram shows overlap of GR ChIP-seq peaks called at early dex exposure time points (5–25 min) and at late time points (0.5–12 h). (C) Venn diagram shows the number of distal non-EP300-/non-CTCF-bound preaccessible DHSs and enhancers with initial EP300 binding within 500 bp of GR binding sites at 5 min of dex exposure. (D) Heatmaps show DNase-seq and input-subtracted ChIP-seq signal in reads per million (RPM) in chromatin accessibility-matched distal non-EP300-/non-CTCF-bound preprogrammed DHSs (left) and preprogrammed EP300 sites (right). Above, aggregate profile plots show mean RPM per base pair across sites in heatmaps. Regions shown range from −1 to +1 kb from site center. (E) Schematic of elastic net regression model (top) is shown along with estimated nonzero coefficients (below) across the time course. Error bars, SD of coefficient estimates across 1000 bootstrap samples. (F) Box-and-whisker plots show log2 fold change in standardized GR binding every 5 min for the first 25 min across the set of all enhancers split into quintiles either by initial enhancer activation (left) or by GR motif strength (right). Observations greater than 1.5× interquartile range beyond the first or third quartiles are shown as outliers. Ordinary least squares regression lines are shown in green and red.


