
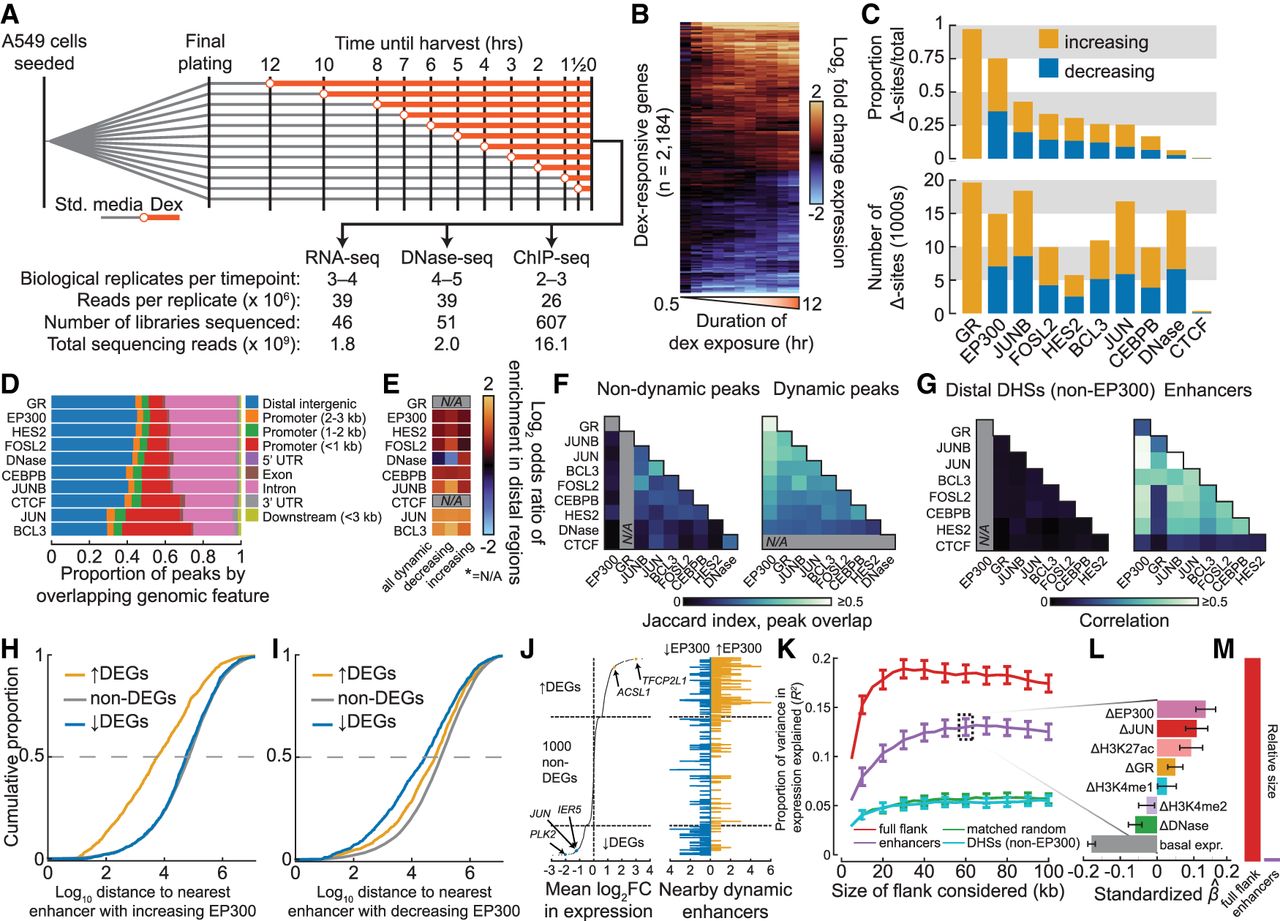
Dynamics of the genomic GC response are highly coordinated in enhancers and correlate with changes in gene expression. (A) Schematic shows experimental design for dex exposure time course and summary of sequencing effort. (B) Heatmap shows log2 fold change in gene expression for all dex-responsive genes over the time course as assayed by RNA-seq, quantified at the gene-level, and hierarchically clustered by complete linkage. (C) Bar plots show the proportion (above) and the total number (below) of differential sites across all ChIP-seq peak sets and DHSs, split into sets with increased and decreased signal with respect to the pre-dex time point. (D) Bar plot shows the proportion of ChIP-seq peaks and DHSs by genomic annotation with respect to protein-coding genes. (E) Heatmap shows the enrichment of differentially bound (or accessible) peaks in distal regions (distal intergenic or intron from D) versus nondynamic peaks. (N/A means not applicable.) (F) Heatmaps show Jaccard index of overlap for sets of nondynamic peaks (left) and for dynamic peaks (right). (G) Heatmap represents mean Pearson correlation coefficients in log2 fold change in binding of TFs within distal non-EP300-bound DHSs (left) and enhancers (right) as measured by ChIP-seq. (H) Cumulative distribution of distance of protein-coding genes by dynamics class to nearest neighboring enhancer with increased EP300 upon dex exposure. (I) Same as H, except distances are to enhancers with decreased EP300. (J) Plot shows mean log2 fold change of all differentially expressed genes and 1000 randomly selected nondifferentially expressed genes, all sorted in descending order (left). Data points for selected genes discussed in text are annotated and colored. Bar plot shows number of enhancers within increased EP300 and decreased EP300 within 20 kb (right) of the genes ranked at left. (K) Proportion of variance explained in mean log2 fold change in expression (R2; y), and standard error of R2, as a function of size of the window (x) within which the ChIP-seq and DNase-seq data were summed. Epigenomic data were summed either in the full flank or in subsets of the full flank as indicated. Mappings in the 3-kb TSS-proximal region were ignored in order to focus solely on distal regions. (L) Standardized estimated coefficients shown for the elastic net model in which change in expression was regressed on change in control-subtracted ChIP-seq and DNase-seq signal in enhancers within 60 kb of genes (see K). Standard deviations of coefficients are shown, which were computed by estimating coefficients from 1000 bootstrap replicates. (M) Bar plot shows relative size of the genomic region covered by the enhancer set within 100 kb of all tested gene TSSs compared with the full 100-kb windows.


