
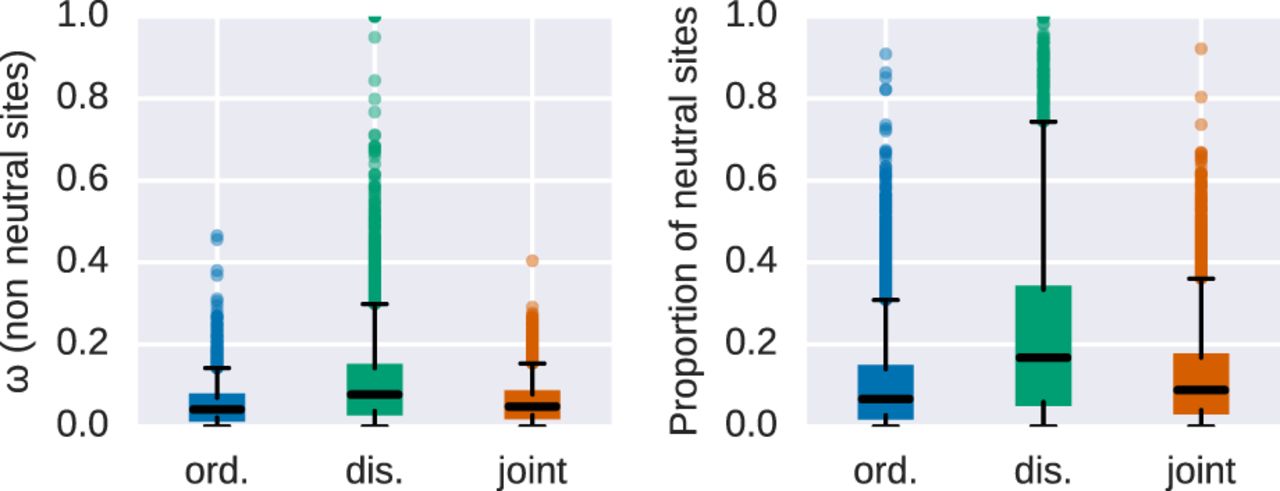
Figure 2.
Estimates of sequence evolution in a nearly neutral model. Distributions of ω = dN/dS values (left panel) and the proportion of the neutrally evolved sites (right panel) for ordered (blue), disordered (green), and ordered and disordered protein regions jointly analyzed (orange).


