
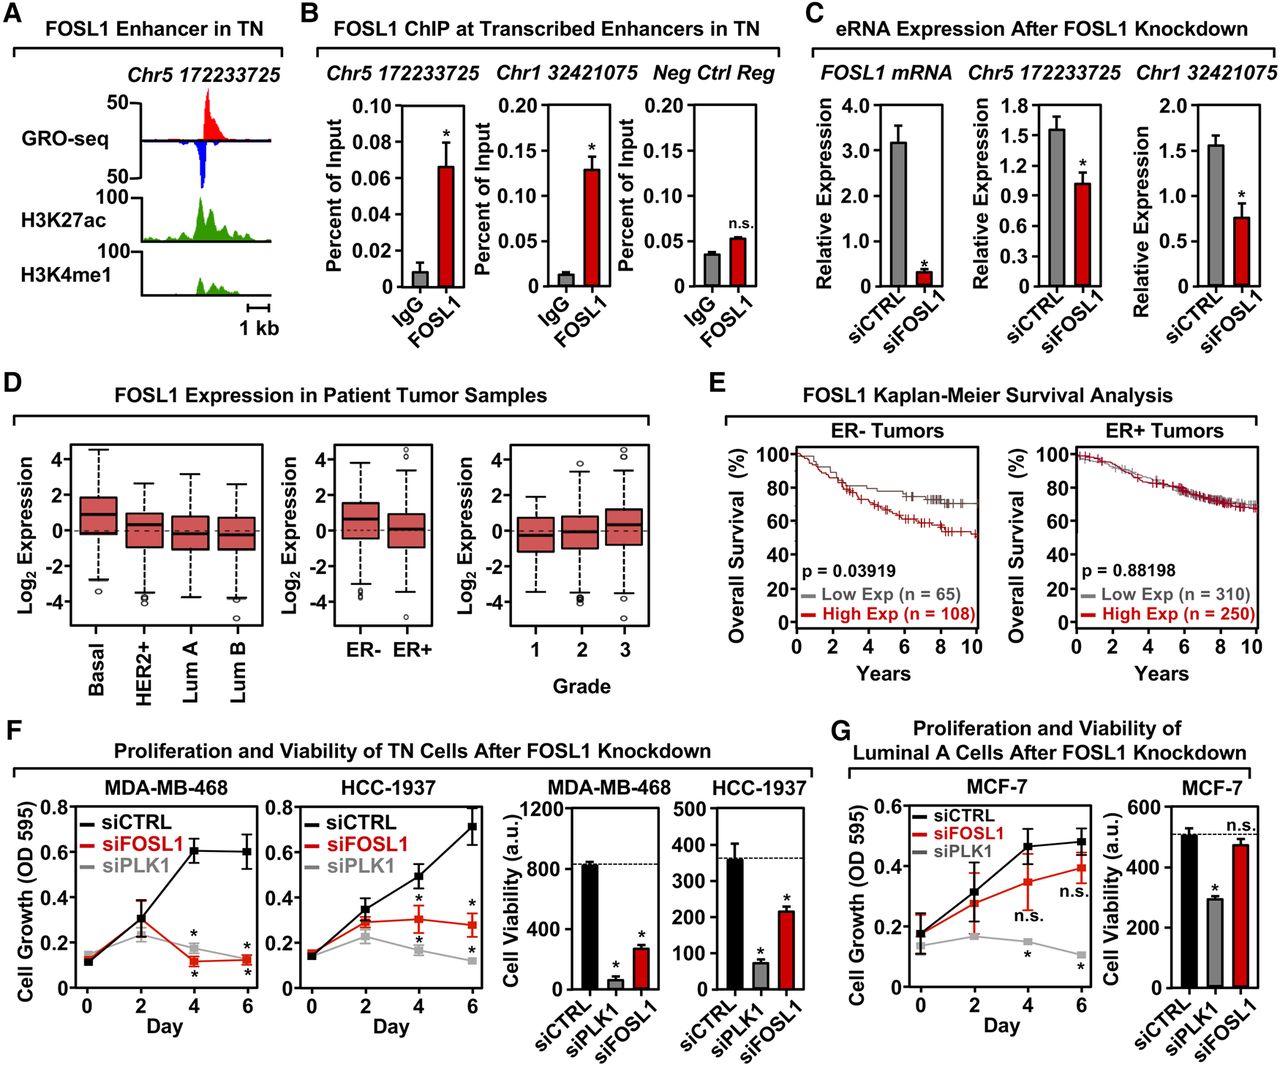
FOSL1 is enriched at transcribed enhancers in TN cells, regulates cell proliferation, and correlates with breast cancer patient outcomes. (A) Genome browser views of a transcribed enhancer predicted to be bound by FOSL1 in TN cells (GRO-seq; H3K27ac and H3K4me1). The data shown are from TN basal breast cancer cells (HCC-1937). (B) ChIP-qPCR for FOSL1 at two transcribed enhancers predicted to be bound by FOSL1, shown in a TN basal cell line (HCC-1937). The enhancers are designated by their genomic coordinates. Genome browser shots for the enhancer found on Chr 5 are shown in A. Each bar represents the mean + SEM, n = 3. Asterisks indicate significant differences from the corresponding control (Student's t-test, P-value < 0.05). (C) siRNA-mediated knockdown of FOSL1 in a TN basal cell line (HCC-1937) decreases the transcription of cognate enhancers as determined by RT-qPCR. The enhancers are designated by their genomic coordinates. Each bar represents the mean + SEM, n = 3. Asterisks indicate significant differences from the corresponding control (Student's t-test, P-value < 0.05). (D) Box plots of FOSL1 mRNA expression levels in patient tumor samples confirm enrichment of FOSL1 in Basal-like and in ER-negative (ER-) breast tumor samples, as predicted by the TFSEE analysis in breast cancer cell lines. Observed differences are significant as determined by an ANOVA comparison of the means (P-value < 0.00001). (E) FOSL1 mRNA expression is predictive of clinical outcomes in ER-negative (ER-) breast tumor patients. Kaplan-Meier survival analyses of patients expressing high levels of FOSL1 mRNA (maroon line) exhibit a poorer outcome compared to patients expressing low levels of FOSL1 mRNA (gray line). The breast cancer outcome-linked gene expression data were accessed and graphed using the Gene Expression-Based Outcome for Breast Cancer Online (GOBO) tool (Ringnér et al. 2011). (F) siRNA-mediated knockdown of FOSL1 in two TN cell lines (MDA-MB-468 and HCC-1937) causes decreased proliferation and viability, as observed in proliferation assays (left) and cell viability assays (right). siRNA-mediated knockdown of Polo-like Kinase 1 (PLK1) serves as a positive control. Each point or bar represents the mean + SEM, n = 3. Asterisks indicate significant differences from the corresponding control (Student's t-test, P-value < 0.05). (G) siRNA-mediated knockdown of FOSL1 in Luminal A cell line (MCF-7) shows no significant effects on proliferation or viability compared to TN cells. siRNA-mediated knockdown of Polo-like Kinase 1 (PLK1) serves as a positive control. Each bar represents the mean + SEM, n = 3. The asterisks indicate significant differences from the corresponding control (Student's t-test, P-value < 0.05). (n.s.) not significant (Student's t-test, P-value > 0.05).


