
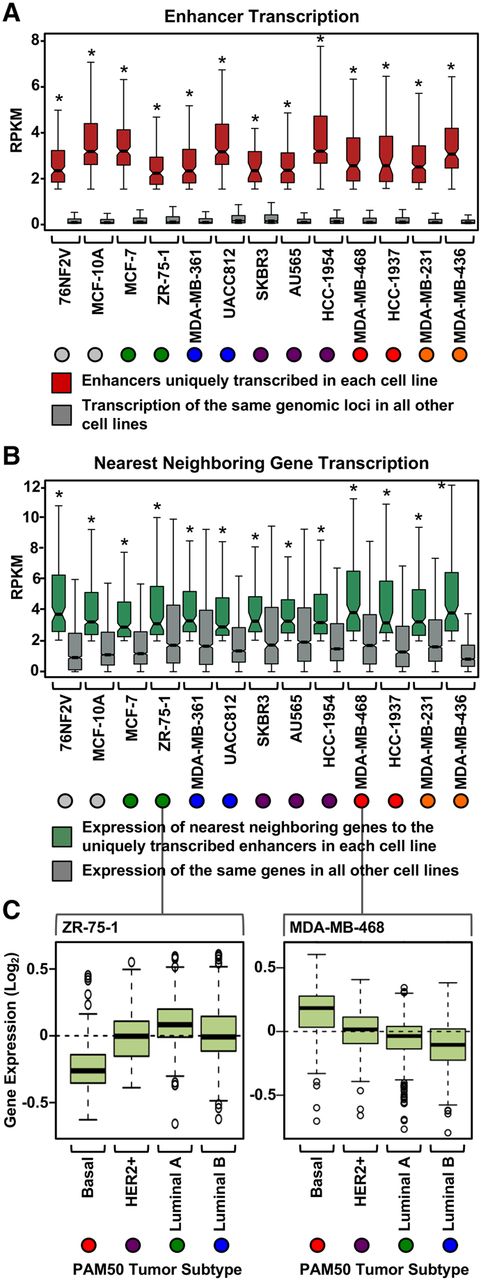
Actively transcribed enhancers dictate subtype-specific transcriptional programs. (A) Box plots of normalized GRO-seq read counts for enhancers uniquely transcribed in a single cell line compared to the transcription of the same genomic loci in all other cell lines. Asterisks indicate significant differences between the two conditions tested for each cell line (Wilcoxon rank-sum test, P < 0.05). Colored circles indicate the molecular subtype of each breast cancer cell line (for the color codes, see Fig. 2B). (B) Box plots of normalized GRO-seq read counts for the nearest neighboring genes to uniquely transcribed enhancers (from A) in a single cell line compared to the transcription of the same genes in all other cell lines. Asterisks indicate significant differences between the two conditions tested for each cell line (Wilcoxon rank-sum test, P < 0.05). (C) The nearest neighboring genes to the uniquely transcribed enhancers in each cell line are preferentially expressed in patient tumor samples of the same molecular subtype. (Left) ZR-75-1 cells represent the Luminal A breast cancer molecular subtype. The nearest neighboring genes to the uniquely transcribed enhancers for ZR-75-1 cells are more highly expressed in Luminal A patient tumor samples compared to the other tumors types. (Right) For comparison, MDA-MB-468 cells represent the TN basal breast cancer molecular subtype. The nearest neighboring genes to the uniquely transcribed enhancers in MDA-MB-468 cells are more highly expressed in TN basal tumor samples compared to the other tumor types. Observed differences are significant as determined by an ANOVA comparison of the means (P-value < 0.00001).


