
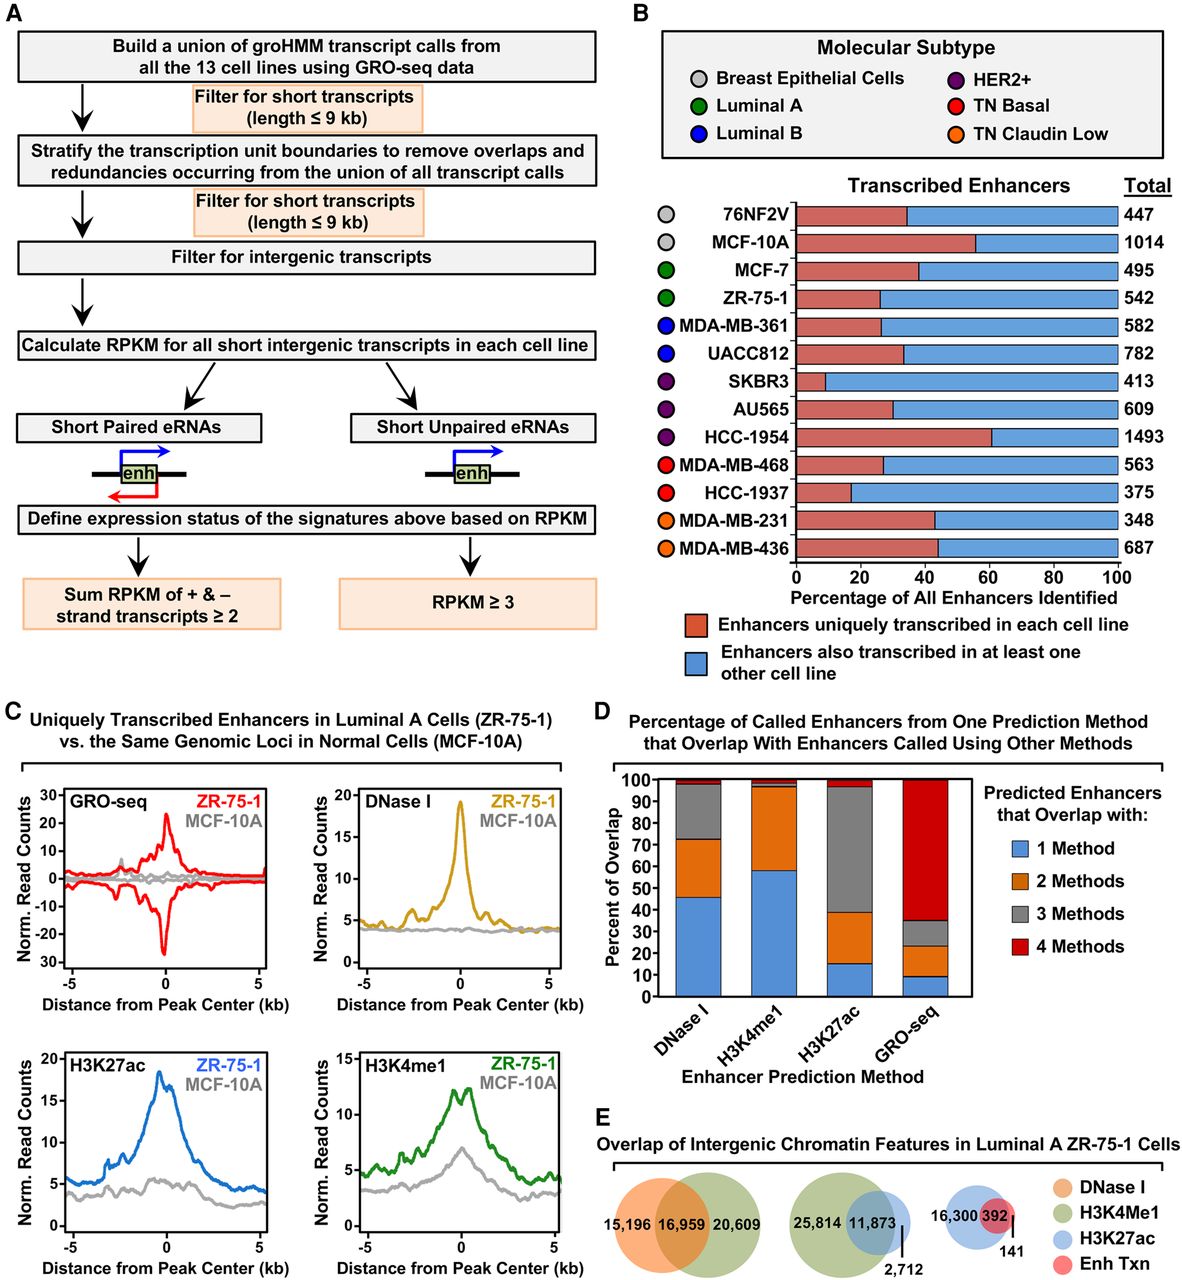
Unbiased, genome-wide prediction of active enhancers using GRO-seq data. (A) Overview of the computational pipeline used for the genome-wide annotation of enhancer transcripts (eRNAs) and prediction of active enhancers using GRO-seq data. (B) Catalog of all predicted active enhancers in the breast cancer cell lines listed in Figure 1A defined by enhancer transcription using the pipeline shown in A. Red indicates cell-type–specific enhancers, and blue represents enhancers transcribed in at least one other cell line. The colored circles indicate the molecular subtype of each cell line. (C) Metaplot analyses showing correlations among enhancer transcription, DNase I hypersensitivity, H3K27ac enrichment, and H3K4me1 enrichment for the uniquely transcribed enhancers identified in ZR-75-1 cells in B. Metaplots for the same genomic loci in MCF-10A cells are shown for comparison (gray lines). (D) Stacked bar chart comparing enhancer prediction methods in ZR-75-1 cells. Intergenic enhancers were called using prediction methods based on four different enhancer features: enhancer transcription (using GRO-seq and the pipeline shown in A), DNase I hypersensitivity, H3K4me1 enrichment, or H3K27ac enrichment. The percentage of called enhancers from each prediction method overlapping enhancers called using one or more of the other methods is shown. (E) Venn diagrams showing the number of enhancers called in ZR-75-1 cells and the overlap of enhancers called using DNase I and H3K4me1 (left), H3K4me1 and H3K27ac (middle), and H3K27ac and enhancer transcription (right).


