
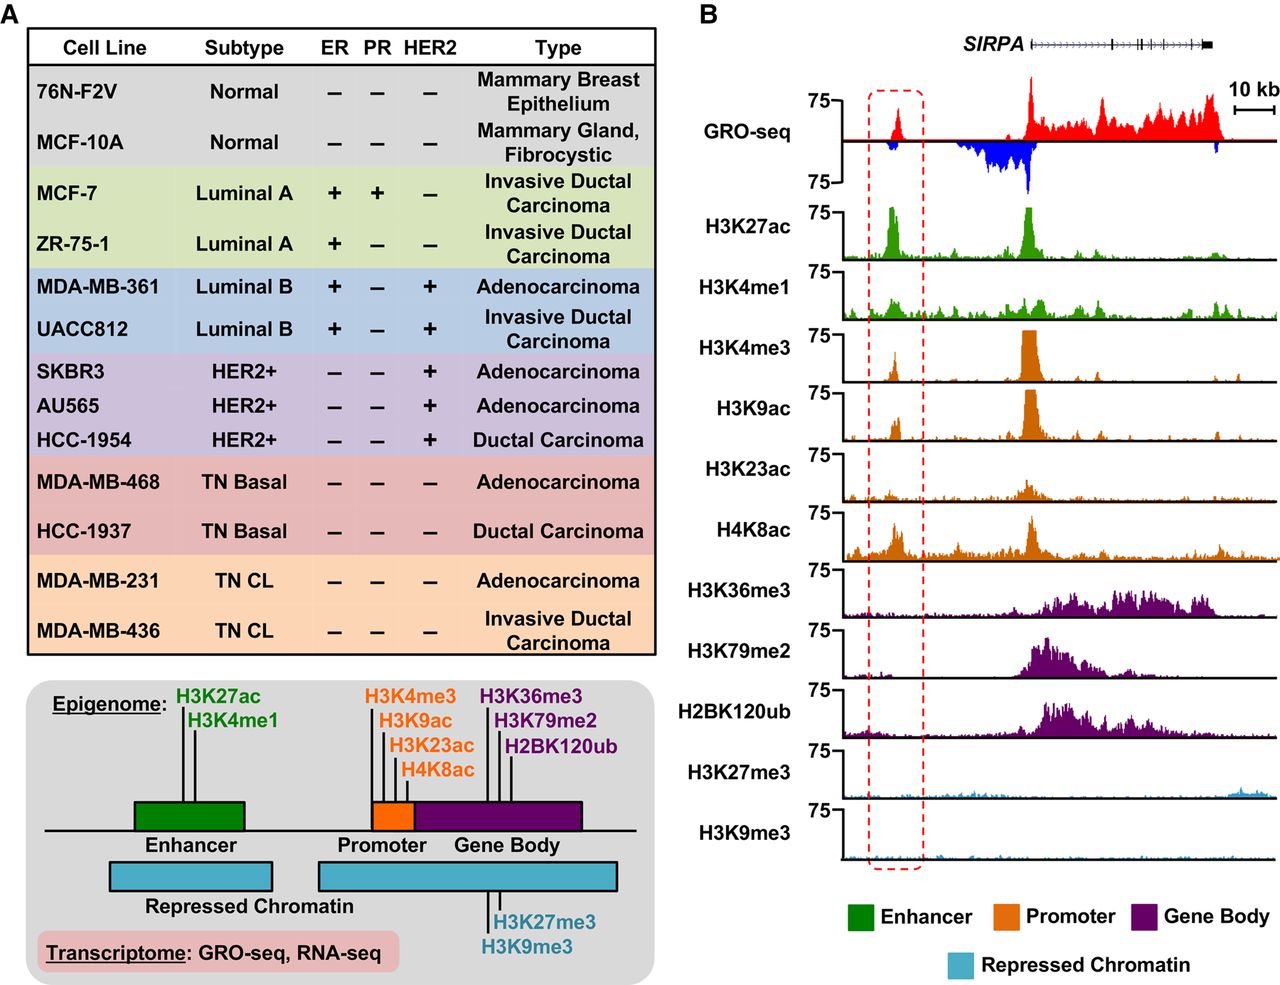
Transcriptional and epigenomic profiling identifies putative enhancers across the breast cancer genome. (A, top) Features of cell lines representing five distinct molecular subtypes of breast cancer, which were used in this study, including ER, PR, and HER2 status. (CL) Claudin-low. (Bottom) Depiction of the transcriptional (GRO-seq and RNA-seq) and epigenomic (ChIP-seq) profiles generated for each cell line. (B) Genome browser views of GRO-seq and histone modification ChIP-seq data from a normal breast epithelial cell line (76N-F2V) showing the features of a typical bidirectionally transcribed enhancer (red box with dashed line) and its nearest neighboring gene (SIRPA). Key features include transcription (red/blue), as well as histone modifications typically enriched at enhancers (green), promoters (brown), gene bodies (purple), and repressed chromatin (turquoise).


