
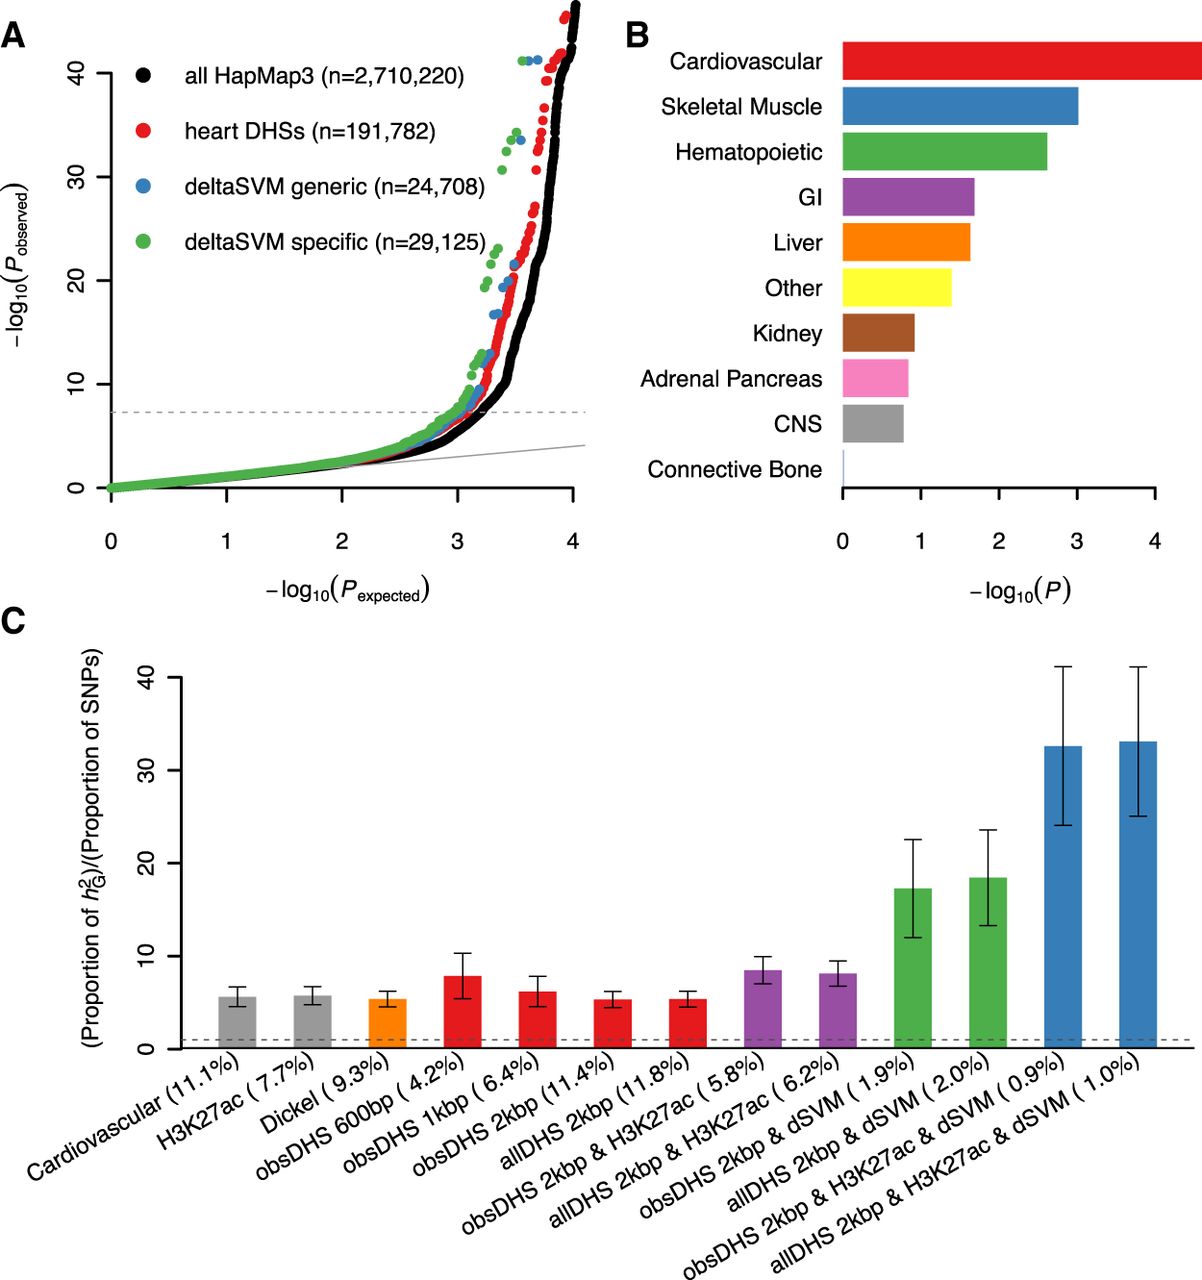
Cardiac regulatory variants explain QT-interval heritability. (A) Q-Q plots of QTi GWAS results using different subsets of common genome-wide sequence variants (numbers of variants in parentheses); the dashed gray line indicates the genome-wide significance threshold (P < 5 × 10⁻⁸). (B) Comparison of enrichment P-values between 10 predefined cell-type group functional annotations. (C) Enrichment values, estimated as the fraction of the heritability (hG2) explained by variants over the fraction of the SNPs, for various heart DHS-based annotations. (Cardiovascular) the predefined cell-type group functional annotation for cardiovascular tissues, (H3K27ac) H3K27ac marks in heart, (Dickel) heart CRE map from Dickel et al. (2016), (obsDHS 600 bp) observed DHSs, (obsDHS 1 kb/2 kb) observed DHSs with 1-kb/2-kb extension, (allDHS 2 kb) observed and predicted DHSs with 2-kb extension, (dSVM) deltaSVM predicted variants. A combination of multiple annotations indicates intersection of them. For example, “obsDHS 2 kbp & dSVM” means a set of variants predicted by deltaSVM and overlapping observed DHSs with 2-kb extension. The proportion of SNPs are in parentheses; error bars denote standard errors estimated by a block Jackknife method; no enrichment is shown as a dashed line.


