
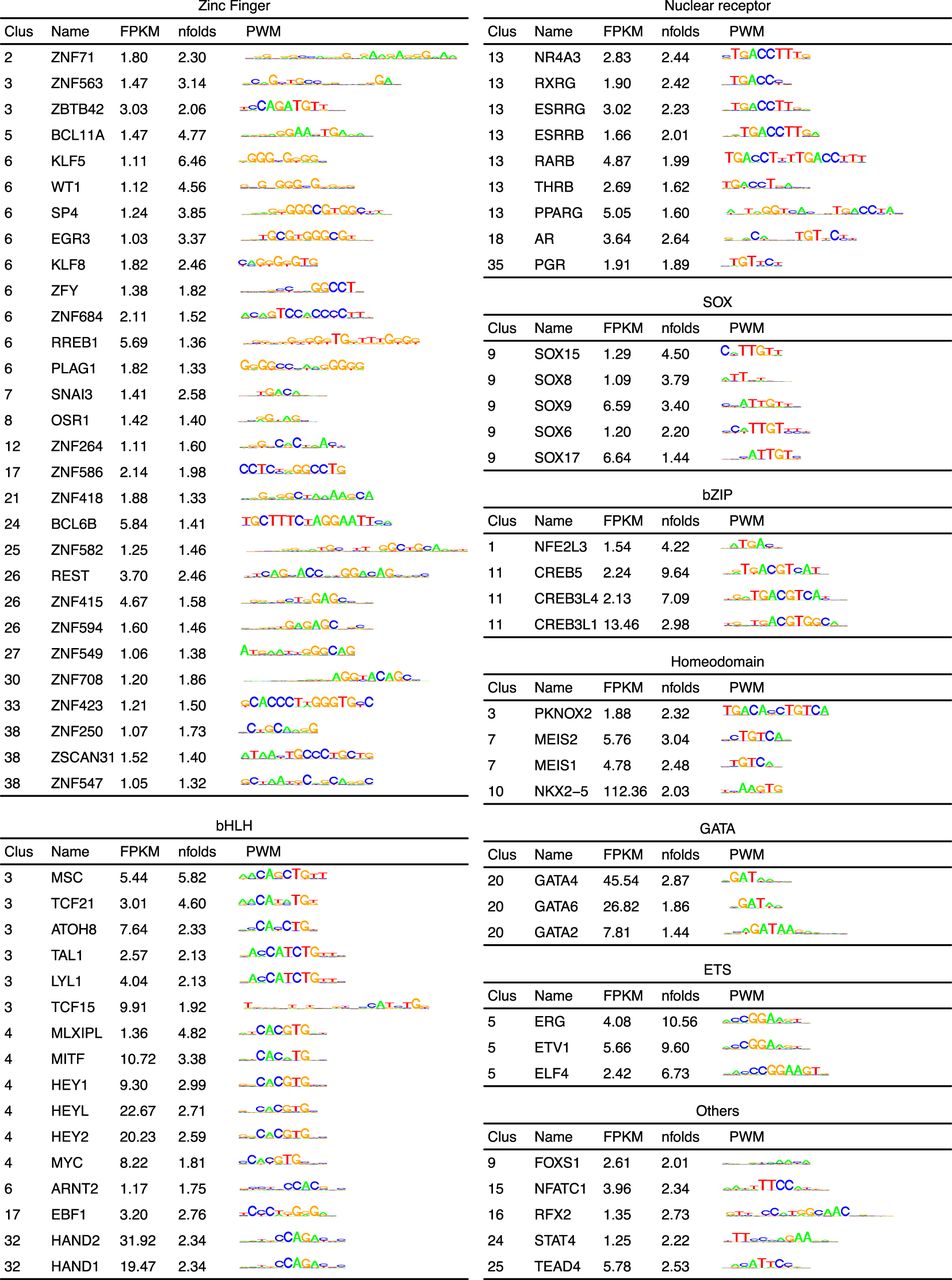
Figure 4.
A list of 78 TFs enriched in heart DHSs as well as selectively expressed in cardiac tissues. The 78 TFs were grouped based on their DNA binding domain families. These PWMs were also clustered based on their sequence specificity. For each TF, cluster number (Clus), name, gene expression (FPKM) in left ventricle, fold enrichment (nfolds), and PWM are shown, respectively.


