
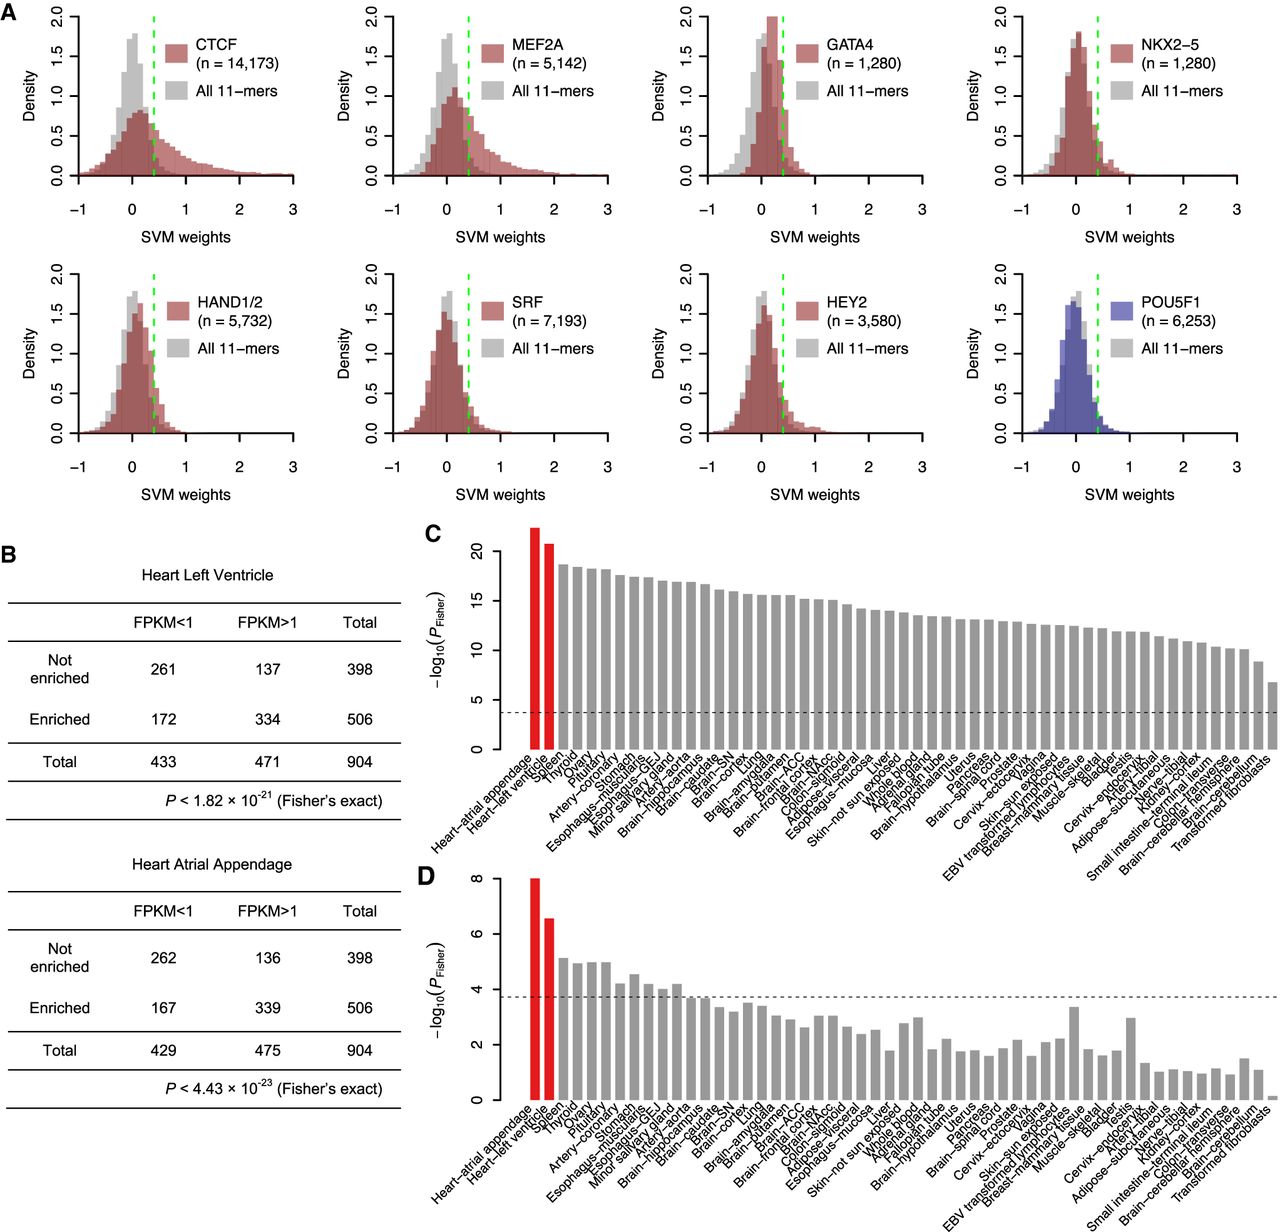
Learned sequence features identify cardiac TFs. (A) SVM weight distributions of PWM-matched 11-mers for the top two scoring TFs (CTCF and MEF2A), five well-known cardiac-specific TFs (GATA4, NKX2-5, HAND1, HAND2, SRF, and HEY2), and a cardiac-irrelevant TF (POU5F1). The fifth percentile is shown as a green line. The enrichment is defined as the fraction of TFBS-matching 11-mers in the top fifth percentile of all 11-mers compared to the expected fraction (5%). (B) 2 × 2 contingency tables comparing TFs enriched in heart DHSs with TFs expressed in heart left ventricles (top) and atrial appendages (bottom). (C,D) −log10(P) of one-sided Fisher's exact test for every tissue tested using all TFs (C) and after removing commonly expressed TFs (D); the two tissues from adult heart (atrial appendage and left ventricle) are highlighted in red with the Bonferroni-corrected P-value threshold (0.05) shown as a dashed line.


