
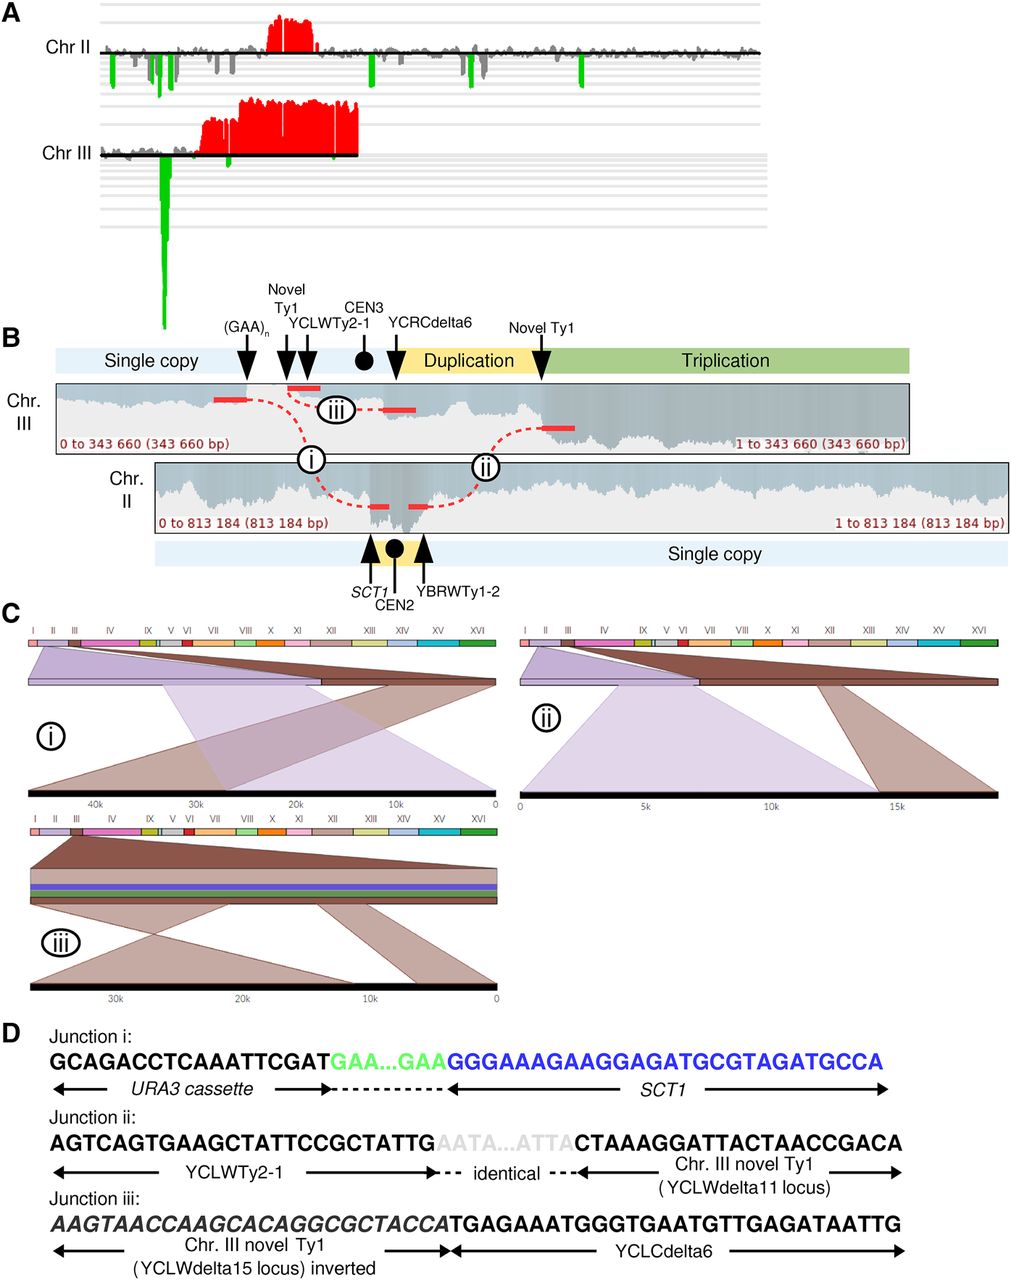
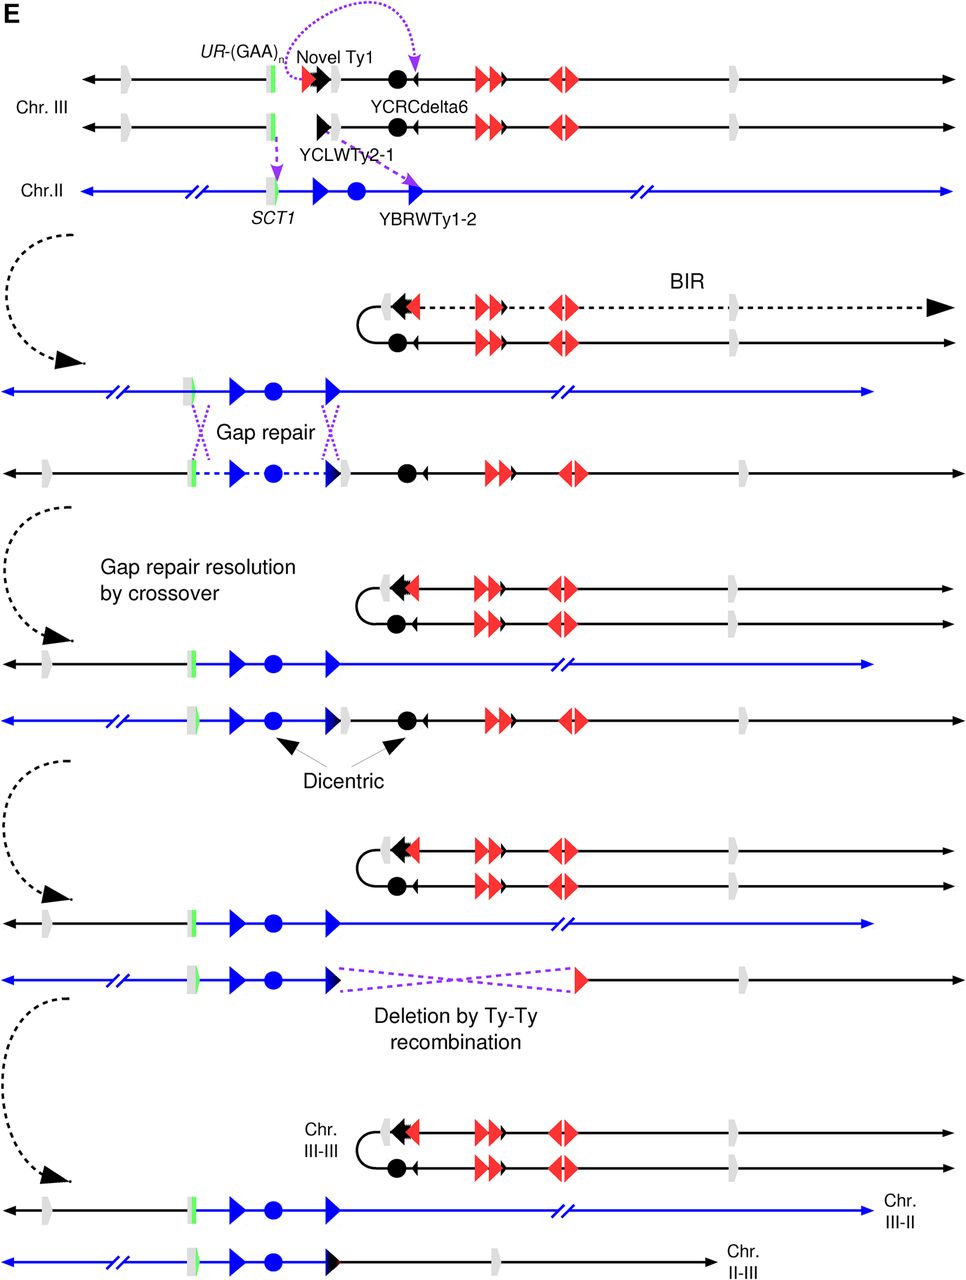
Identifying complex genomic rearrangements in strain 105. (A) CGH microarray analysis, displaying results for Chromosomes II and III. Large green and red areas show regions of the chromosome that are deleted and duplicated, respectively. By examining the hybridization values for individual oligonucleotides on the microarrays, we found that the small green regions depicted in this figure do not represent true deletions. (B) Nanopore sequencing coverage maps of Chromosomes III and II, generated via UGENE. Positions of relevant sequence features and large-scale copy number changes are indicated above and below the coverage maps. Positions of observed split reads are overlayed on the coverage map, and are labeled i–iii. (C) Ribbon single-read view corresponding to the indicated split reads. The X-shaped window in the third panel indicates that this portion of the read maps to an inversion of the chromosome. (D) Single base pair resolution of the indicated junctions. Junction i shows that the break and repair occurred within the (GAA)n repeats. Junction ii shows that the split read joining YBRWTy1-2 and the novel Ty1 on the right arm of Chromosome III actually contains sequences matching to YCLWTy2-1 on the left arm of Chromosome III, suggesting an intermediate step involving a dicentric chromosome (see main text for details). The gray region represents a 46-bp window of identity, with SNPs on either side identifying the specific Ty element (Supplemental Fig. S6E). The unannotated Ty1 element is the second of two Ty1 elements inserted in place of YCRWdelta11 (Supplemental Fig. S3). Junction iii shows the inverted left arm of Chromosome III joining to the beginning of the YCRCdelta6 LTR on the right arm of Chromosome III. (Figure continues on following page.)(E) Diagram of the CGR event. Chromosome maps have the same format as in Figure 1A. Relevant features are labeled. Purple arrows indicate sites of HR invasion. Purple dashed lines indicate sites of Holliday junctions. The top portion displays the broken Chromosome III following duplication and processing to expose ends for HR, as well as the donor Chromosome II. The second portion displays an intermediate step in which two new chromosomes have been formed, one by intrachromosomal BIR and another by gap repair using Chromosome II as a donor, resulting in a dicentric. The third portion shows the previous gap repair resolved as a crossover, resulting in a reciprocal translocation. In the fourth portion, a DSB in the dicentric chromosome is processed to expose homology between the two Ty elements, recombination between which results in deletion of CEN3; this recombination event could be a crossover (as shown) or a single-strand annealing event. The bottom portion displays the final chromosome products. See main text for details.


