
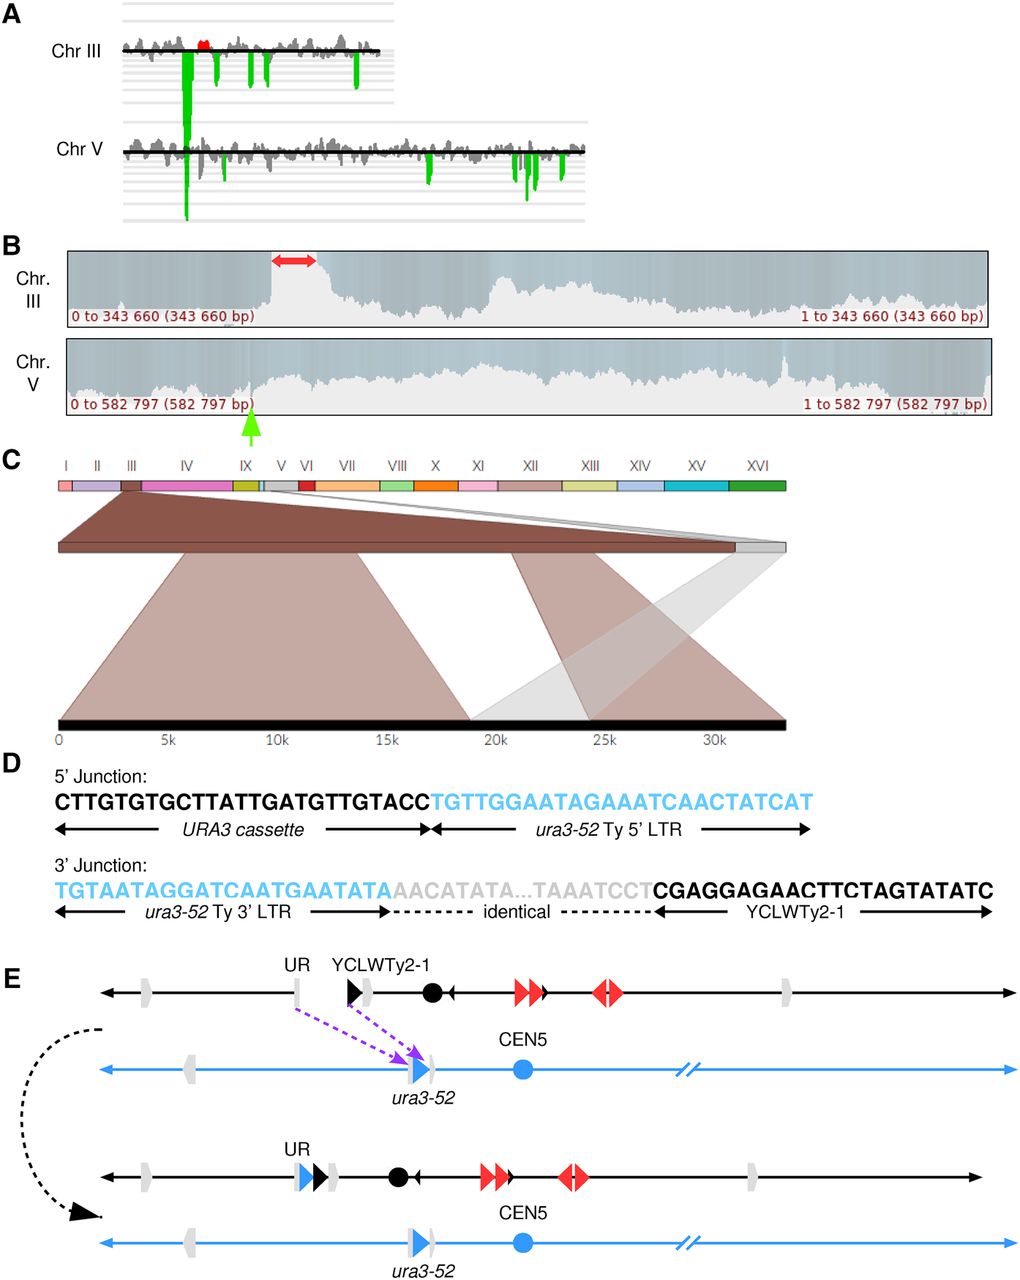
Identifying genomic rearrangements in strain 101. (A) CGH microarray analysis displaying results for Chromosomes III and V. The large green region corresponds to the deletion surrounding the repeats. By examining the hybridization values for individual oligonucleotides on the microarrays, we found that the small red and green regions depicted in this figure do not represent true duplications and deletions, respectively. (B) Nanopore sequencing coverage maps of Chromosomes III and V, generated via UGENE, with a red arrow highlighting the deletion boundaries and a green arrow highlighting the duplication at ura3-52. (C) Ribbon single-read view highlighting a read mapping the entirety of the gene conversion event in which a Ty element was inserted in place of the 3′ half of the UR-(GAA)100-A3 cassette on Chromosome III. (D) Single base pair resolution of the 5′ and 3′ breakpoints of the deletion. The 5′ junction connects the 5′ portion of the UR-(GAA)100-A3 cassette with ura3-52 on Chromosome V. Note that the crossover could have occurred anywhere in the 341 bp of identity between the cassette and ura3-52. The 3′ junction consists of the 3′ LTR region of ura3-52 and YCLWTy2-1 on Chromosome III. The gray region represents an 80-bp window of identity between ura3-52 and YCLWTy2-1 in which the gene conversion occurred. SNPs are visible in the alignment on each side of this window (Supplemental Fig. S4C). (E) Diagram of the CGR event resulting in a gene conversion. Chromosome maps have the same format as in Figure 1A. Relevant features are labeled. Purple arrows indicate sites of HR invasion. The top portion displays the broken Chromosome III, processed to expose ends for HR, and the donor Chromosome V. The bottom portion displays the final chromosome products. See main text for details.


