
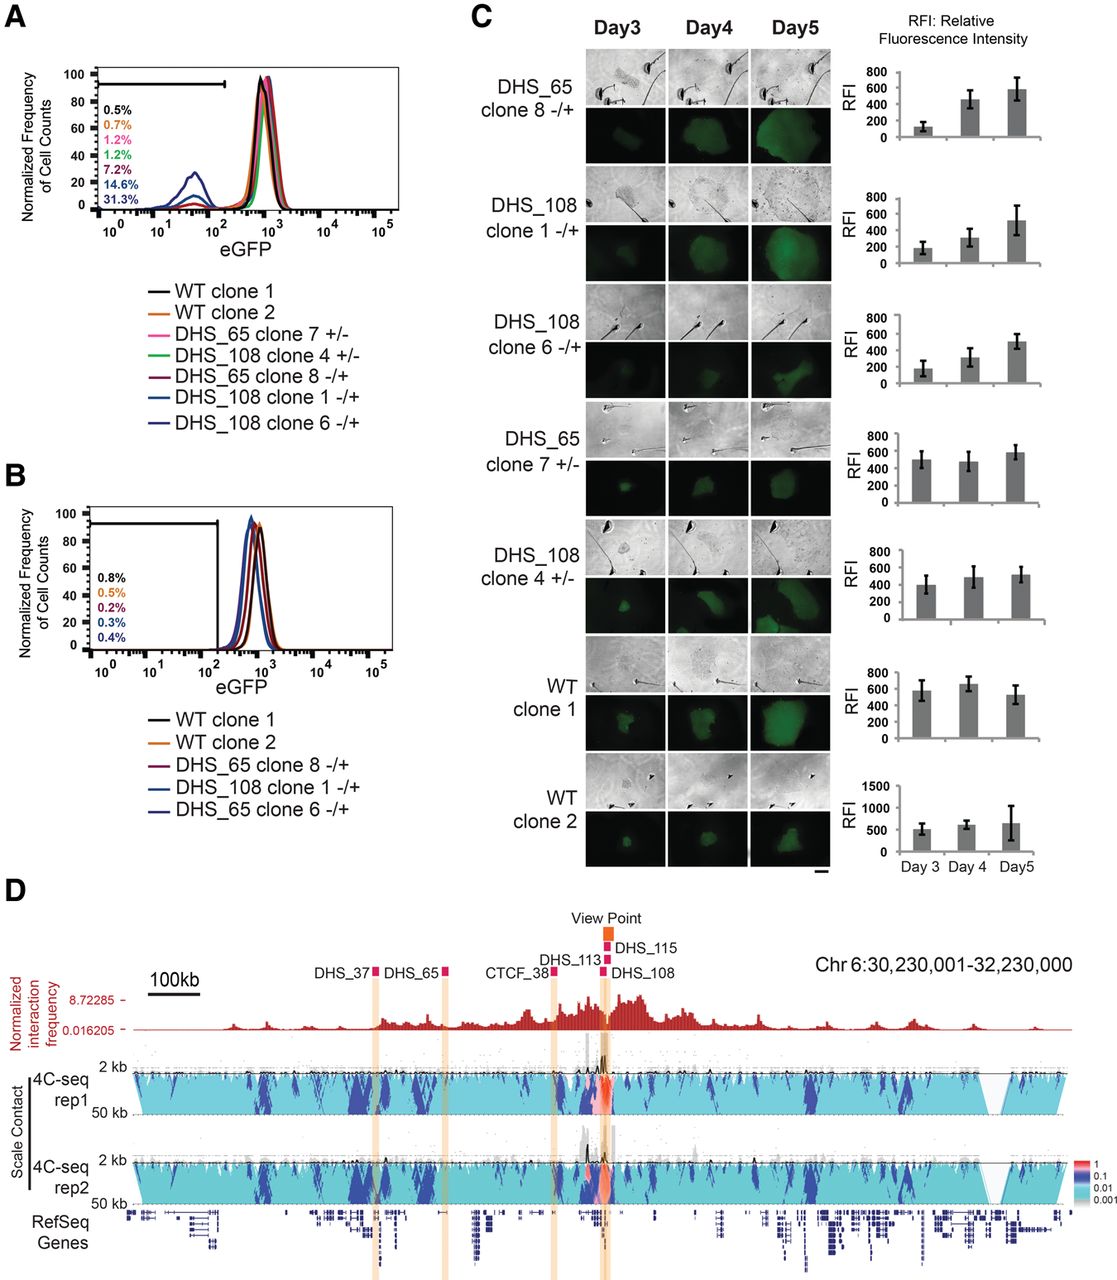
DHS_65 and DHS_108 regulate POU5F1 in cis. (A–C) Cell clones harboring monoallelic deletion of DHS_65 and DHS_108 were generated by cotransfection of H1 POU5F1-eGFP cells with a pair of pX330 plasmids expressing sgRNAs flanking each locus. P1 is the eGFP-containing allele, while P2 is the non-eGFP allele according to the SNP phasing information in the H1 genome (see Methods; Supplemental Fig. S7). Genotype information for mutant clones is indicated by + (WT) or − (KO) labeling in the order of P1/P2. FACS analysis was performed for the parental cell line and monoallelic mutant clones for DHS_65 and DHS_108 at early passages (A) and late passages (B). Note only the P1 allele (eGFP allele) deletion impaired eGFP expression in a subpopulation of cells for each clone, while the eGFP levels in the clones for P2 allele (non-eGFP allele) deletion were not affected. The GFP− population sorted from clones in A regained eGFP signals comparable with the wild-type clones in B. (C) Time-course colony image tracing experiments showed monoallelic mutant clones with P1 allele deletion gradually regain eGFP expression in culture, while mutant clones with P2 allele deletion and WT clones exhibit constant eGFP signal levels. Bar graphs represent RFI for each colony quantified by ImageJ. Scale bar, 200 μm. (D) A genome browser snapshot for chromatin interaction frequencies originating from the POU5F1 promoter. (Top) Normalized chromatin interaction counts in a published Hi-C data set (Dixon et al. 2012). (Bottom) Contact profiles at the POU5F1 locus from two replicates of 4C-seq with the POU5F1 promoter as the bait (highlighted in dark orange). Contact profiles (curves) indicate the frequencies of chromatin interactions, while the probability of interactions is quantified in a multiscale analysis as previously described (van de Werken et al. 2012). Five million H1 POU5F1-eGFP cells were used for each 4C-seq experiment. 4C-seq data were processed with 4C-seq pipeline (van de Werken et al. 2012).


