
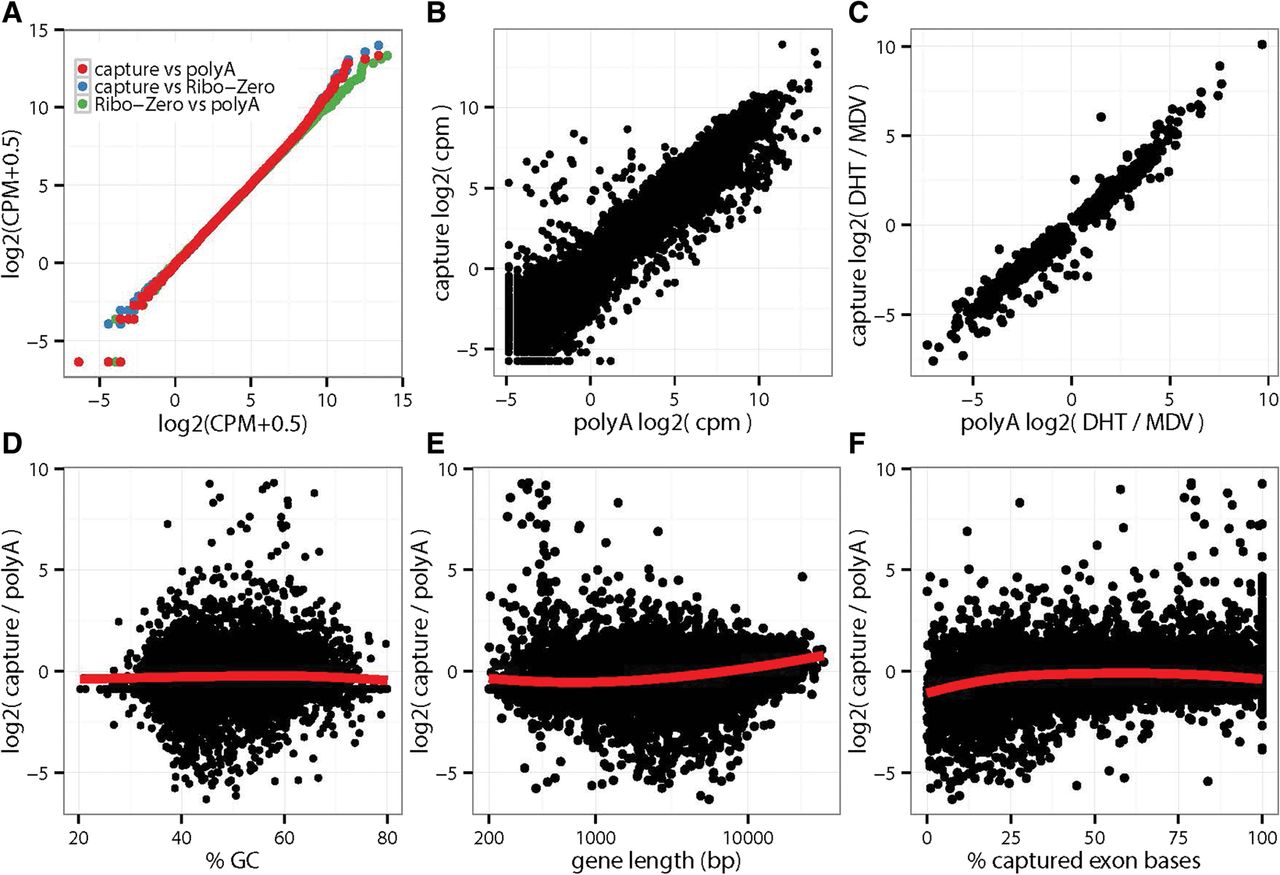
Agreement of absolute and differential gene expression. Expression levels were quantified by counting the number of aligned fragments within captured exonic regions and converted to the log2 of counts per million (log2[cpm]). Treatment log2 fold-changes were estimated through linear modeling. (A) Pairwise Q-Q plots comparing the distributions of gene expression levels. (B) Agreement of absolute levels of transcript abundance log2(cpm). (C) Agreement of differential gene expression between DHT-treated and ablated cells (MDV treatment) (log2 fold-changes). (D–F) Observed differences between capture and poly(A) expression estimates are not driven by GC content, gene length, or fraction of exon bases with target probes.


