
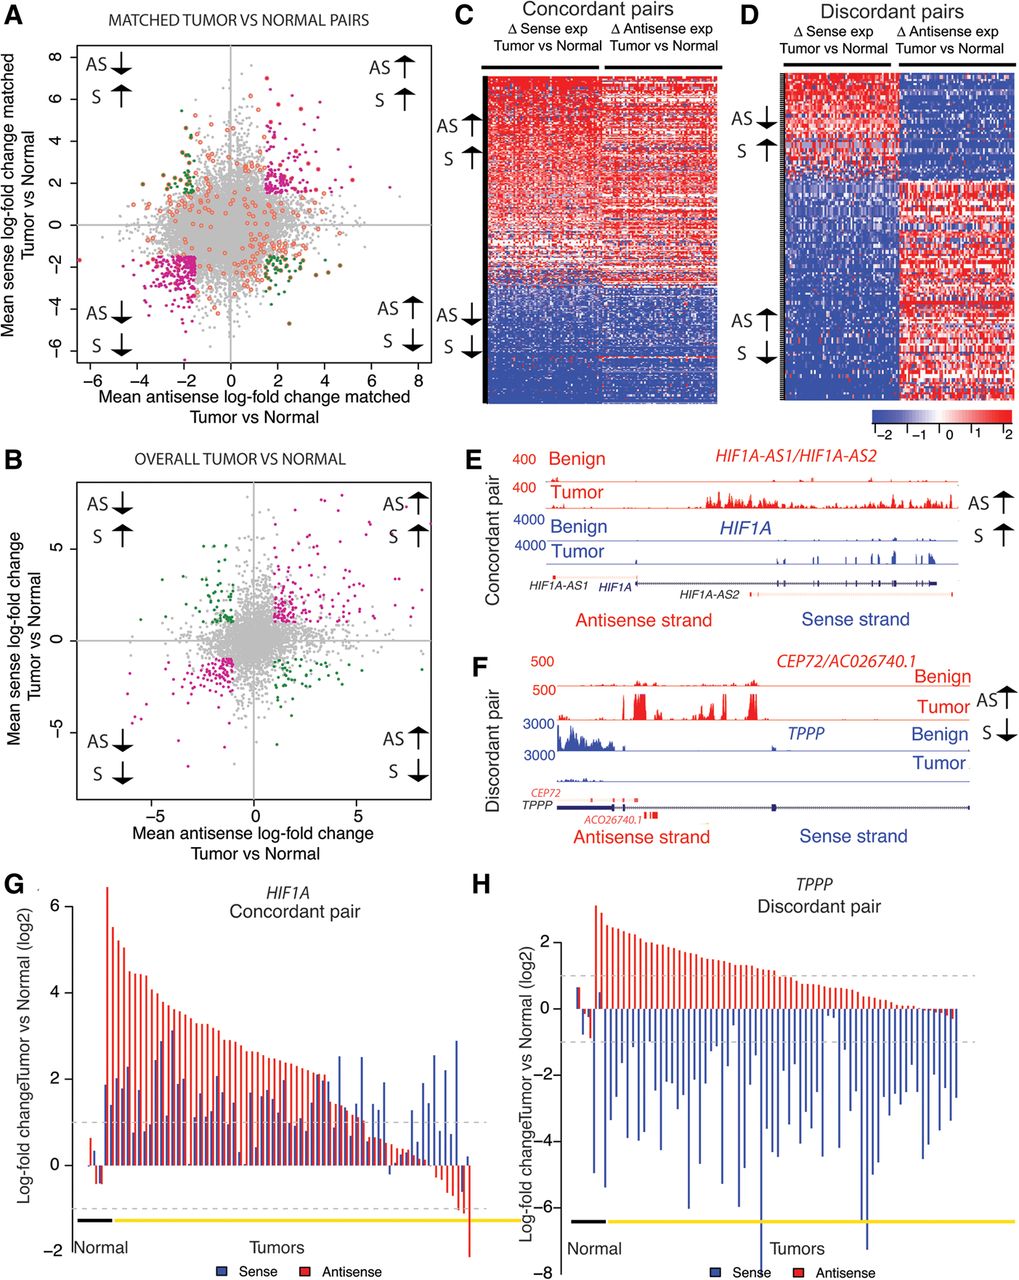
Antisense loci dysregulation in cancer. The expression of the two genes in a cis-NAT pair can both change in a concordant (same direction) or discordant (in opposite direction) manner, when comparing tumor versus normal samples (see Methods). (A) Mean sense expression of log-fold change versus mean antisense expression of log-fold change between matched pairs of lung tumor-normal samples (n = 6 samples, three pairs). Gray dots represent unchanged pairs; green dots, discordant loci; purple dots, concordant loci. A dot is colored orange if the relationship is observed in only one of the tumor-normal matched pairs. (B) Mean sense expression of log-fold change versus mean antisense expression of log-fold change between LUAD tumor (n = 66) and normal samples (n = 3). Color code as in A. (C) Heatmap of cancer-specific concordant cis-NAT pairs. The log-fold change expression between tumor (n = 66) and normal samples (n = 3) for the sense and antisense gene is displayed. Loci are represented in the rows and samples in the columns. Loci are sorted in decreasing order according to average log-fold change across all samples. The color scale ranges from blue (−2) to red (2), in units of log-fold change expression. (D) Heatmap of cancer-specific discordant cis-NAT pairs. The log-fold change expression between tumor (n = 66) and normal samples (n = 3) for the sense and antisense gene is displayed. Loci are represented in the rows and samples in the columns. Loci are sorted in decreasing order according to average log-fold change across all samples. The color scale ranges from blue (−2) to red (2) in units of log-fold change expression. (E) Coverage map for a representative example of a concordant cis-NAT pair (HIF1A). Coverage maps in benign and tumor samples in both sense and antisense strands in the HIF1A locus are presented as individual tracks above the gene schematic. Values on the left indicate track heights. (F) Coverage map for a representative example of a discordant cis-NAT pair (TPPP/CEP72). Coverage maps in benign and tumor samples in both sense and antisense strands in TPPP/CEP72 loci are presented as individual tracks above the gene schematic. Values on the left indicate track heights. (G) Bar plot of the ssRNA-seq expression log-fold change between tumor and normal samples for the concordant pair HIF1A/HIF1A-AS. Red bars indicate antisense expression and blue bars indicate sense transcript expression. (H) Bar plot of the ssRNA-seq expression log-fold change between tumor and normal samples for the discordant pair TPPP/CEP72. Red bars indicate antisense expression and blue bars indicate sense transcript expression.


