
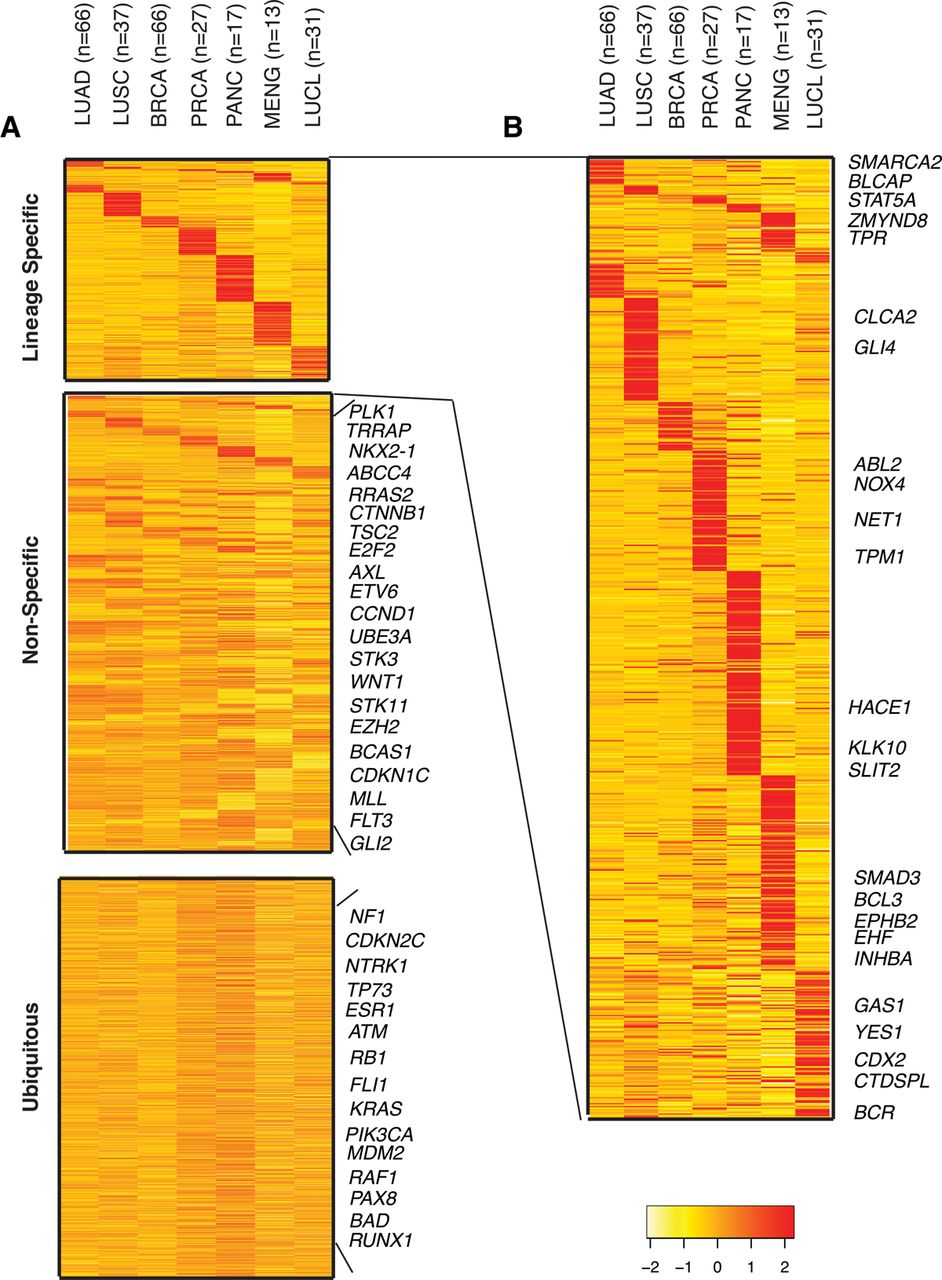
Expression of antisense loci across cancer subtypes. (A) Expression measured in the opposite strand of ubiquitous (n = 3273), tissue nonspecific (n = 4798), and lineage-specific (n = 653) antisense loci involving protein-coding genes. Only loci involving protein-coding genes are depicted in the heatmap, and the gene names displayed are therefore for the cognate genes. For each locus, the value represented in the heatmap corresponds to the average read count data across each cancer subtype. For clarity, the values have been centered and scaled by the mean and SD along the rows. Therefore, the color scale ranges from yellow (−2) to red (2), in units of SD from the mean. (B) Zoom in of lineage-specific antisense loci. Loci involving tumor suppressor or oncogenes in different cancer tissue types are labeled in the heatmap. Color scale as in A.


