
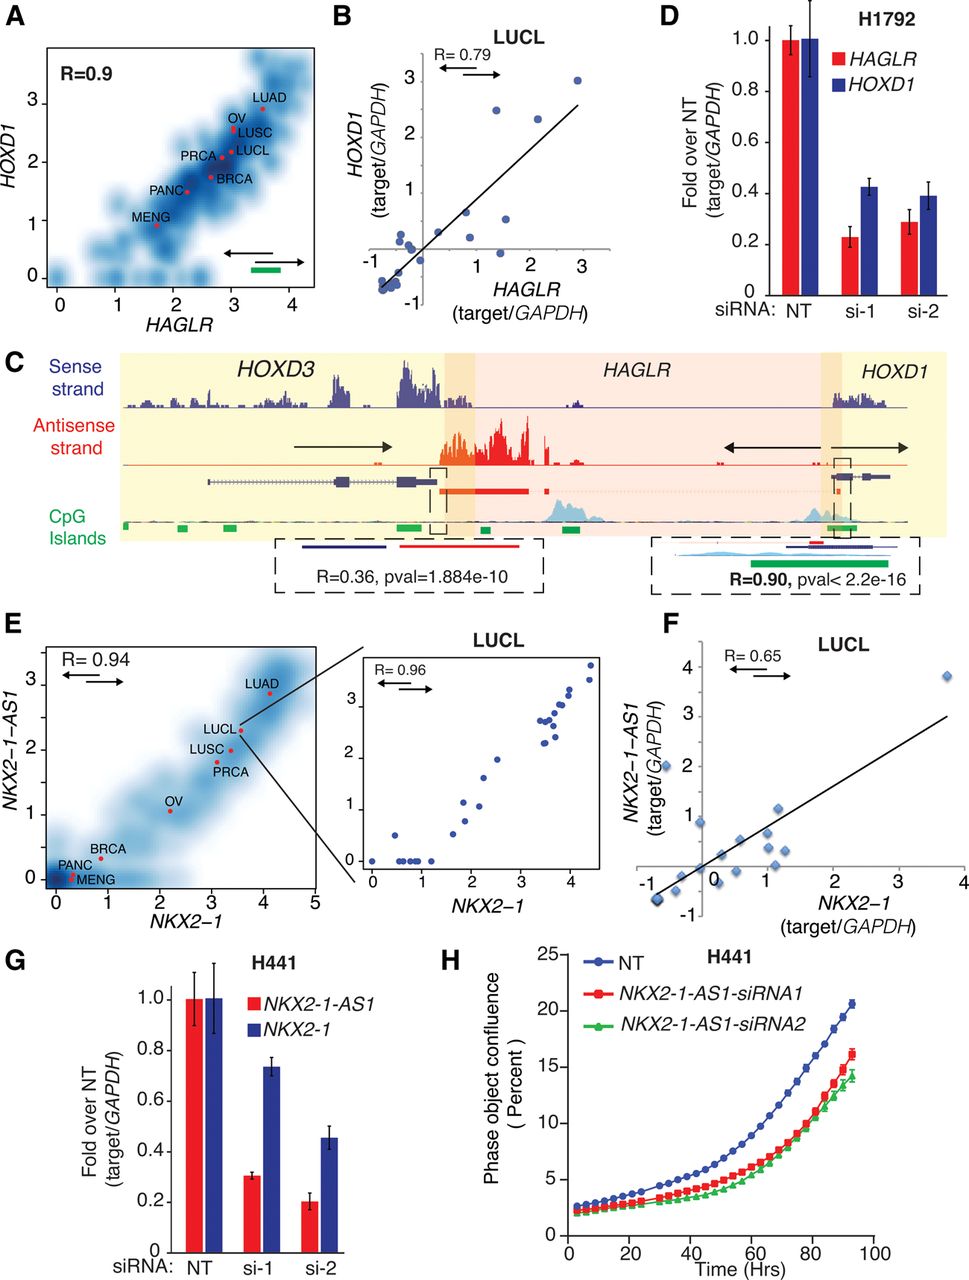
Antisense regulation of cognate sense genes. (A) Density scatter plot for HOXD1/HAGLR expression across the compendium. The units of the x- and y-axis are log10[norm(count)], and red dots indicate the average value for each cohort. (B) HOXD1 and HAGLR expression measured by quantitative PCR across a cohort of 29 lung cell line samples. (C) Representative example of tight coexpression of HTH cis-NAT gene pairs. Loci containing HOXD1/HAGLR/HOXD3 in PRCA sample (mctp_sample_337) is illustrated. Read support for expression in the sense and antisense strands is shown as tracks in blue and red, respectively. Transcript structure, CpG islands (green boxes), and H3K27ac (light blue) tracks are obtained from the UCSC Genome Browser (https://genome.ucsc.edu/) (Karolchik et al. 2014). Yellow and light red shadows represent the limits of sense and antisense genes, respectively. HOXD1/HAGLR HTH gene pair is tightly coexpressed: (right inset) R = 0.90; P-value ≤ 2.2 × 10⁻¹⁰. These transcripts share an overlapping region containing CpG islands, suggesting a bidirectional promoter. HOXD3/HAGLR, on the other hand, form a TTT gene pair with a lower coexpression pattern ([left inset] R = 0.36; P-value = 1.9 × 10⁻¹⁰) and no CpG islands in the overlapping region. (D) Knockdown of HOXD1-AS1 in the H1792 cell line, which expresses HOXD1 sense/antisense transcripts with two independent specific siRNAs. Knockdown decreases the expression levels of both the antisense (HOXD1-AS1) and the cognate sense genes (HOXD1). (E) Density scatter plot for the expression of NK2 homeobox 1 (NKX2-1), master regulator essential for lung development, and NKX2-1-AS1 (R = 0.94). In the inset, a density scatter plot showing only the sense and antisense expression for the samples in the ssRNA-seq lung cell line cohort (R = 0.96). The units of the x- and y-axis are log10[norm(count)], and red dots indicate the average value for each cohort. (F) NKX2-1 and NKX2-1-AS1 expression measured by quantitative PCR across a cohort of 29 lung cell line samples. (G) Knockdown of the antisense gene NKX2-1-AS1 with two independent and specific siRNAs decreases the expression level of their cognate sense gene NKX2-1 in H441, a cell line that expresses both transcripts (see also Supplemental Fig. S8). (H) Knockdown of the antisense gene NKX2-1-AS1 with two independent siRNAs impairs proliferation of the H441 cell line. The y-axis, “Phase object confluence,” is a label-free measure of cell confluence used for IncuCyteZOOM live-cell imaging platform to assess the cell growth.


