
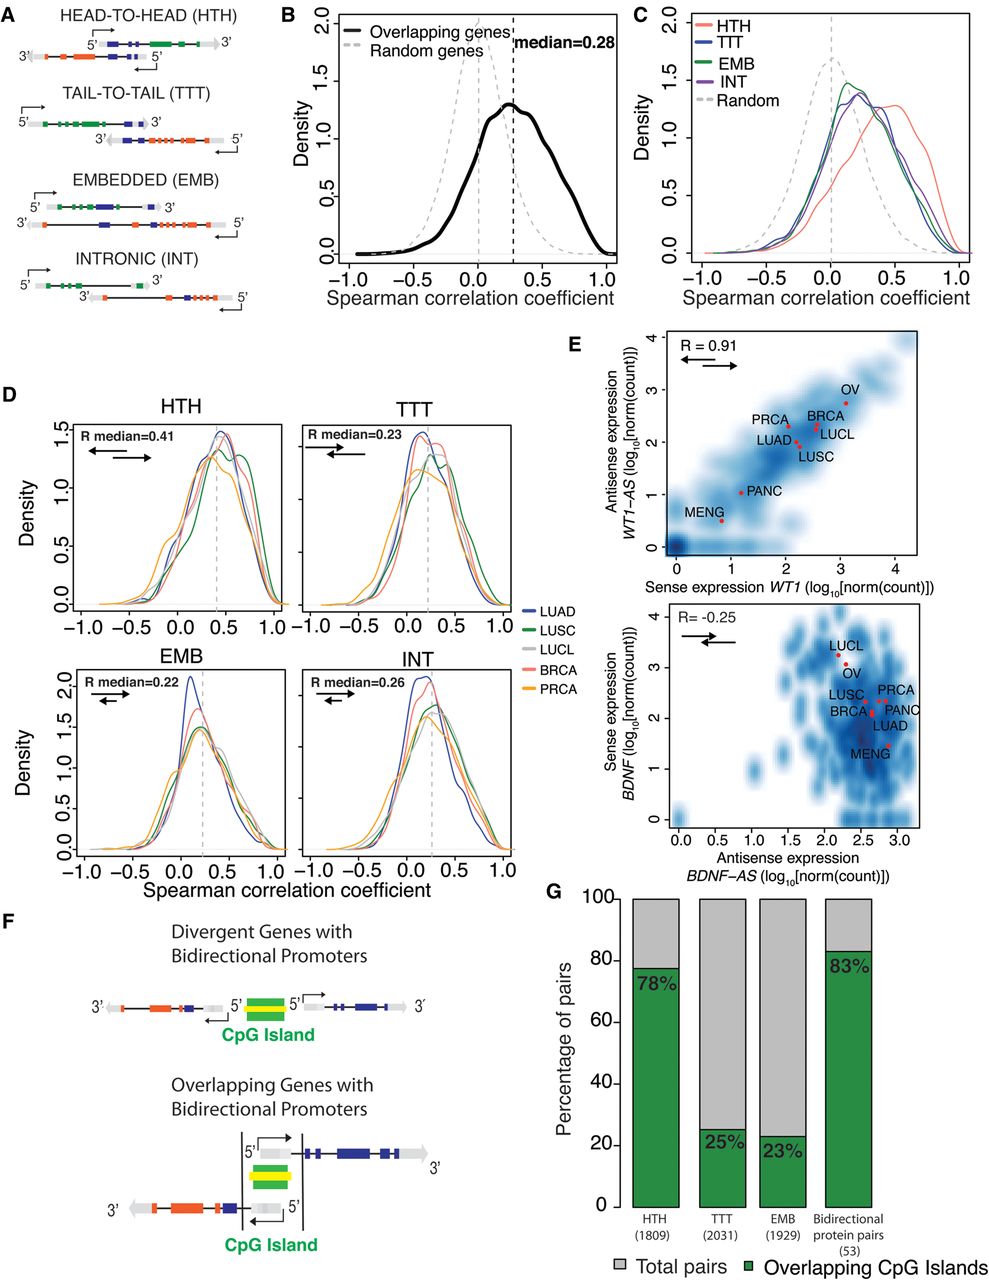
Correlation of cis-NAT pair expression and regulation by bidirectional promoters. (A) Schematic representation of cis-NAT pairs, according to the orientation of the overlapping genes. The arrow indicates transcriptional direction: (dark blue) overlapping exons; (gray) untranslated regions; (green or red) unique exons. (B) Distribution of Spearman's correlation coefficient between sense and antisense expression for all overlapping types (median R = 0.28). Correlation between random pairs of genes is represented by a gray dashed line (n = 14,166). (C) Distribution of Spearman's correlation coefficient between sense and antisense expression by overlapping type. Head-to-Head cis-NAT gene pairs show the highest positive correlation among all overlapping types (median R = 0.41). Correlation between random pairs of genes is depicted by a gray dashed line. HTH = 2485; TTT = 2515; EMB = 2788; and INT = 6378. (D) Distribution of Spearman's correlation coefficient between sense and antisense expression by tissue type. HTH = 2485; TTT = 2515; EMB = 2788; and INT = 6378. (E) Examples of coexpressed cis-NAT gene pairs previously reported. Density scatter plots for WT1/WT1-AS (Dallosso et al. 2007) (top) and BDNF/BDNF-AS (Modarresi et al. 2012) (bottom). The units of the x- and y-axis are log10[norm(count)], and red dots indicate the average value for the each cohort. (F) Schematic representation of CpG islands and bidirectional promoters: (top) CpG islands (green) are present in 80%–95% of bidirectional promoters (yellow) controlling nonoverlapping protein-coding genes in opposite directions; (bottom) model representation of a HTH cis-NAT gene pair sharing a bidirectional promoter located within the overlapping region. Arrows indicate the direction of transcription. (G) Percentage of cis-NAT gene pairs with CpG islands found in their overlapping regions. Seventy-eight percent of HTH cis-NAT contained CpG islands within their overlapping region, similar to the 83% observed for known bidirectional protein-coding gene pairs. Less than 25% of TTT and EMB pairs contained CpG islands in their overlapping regions.


