
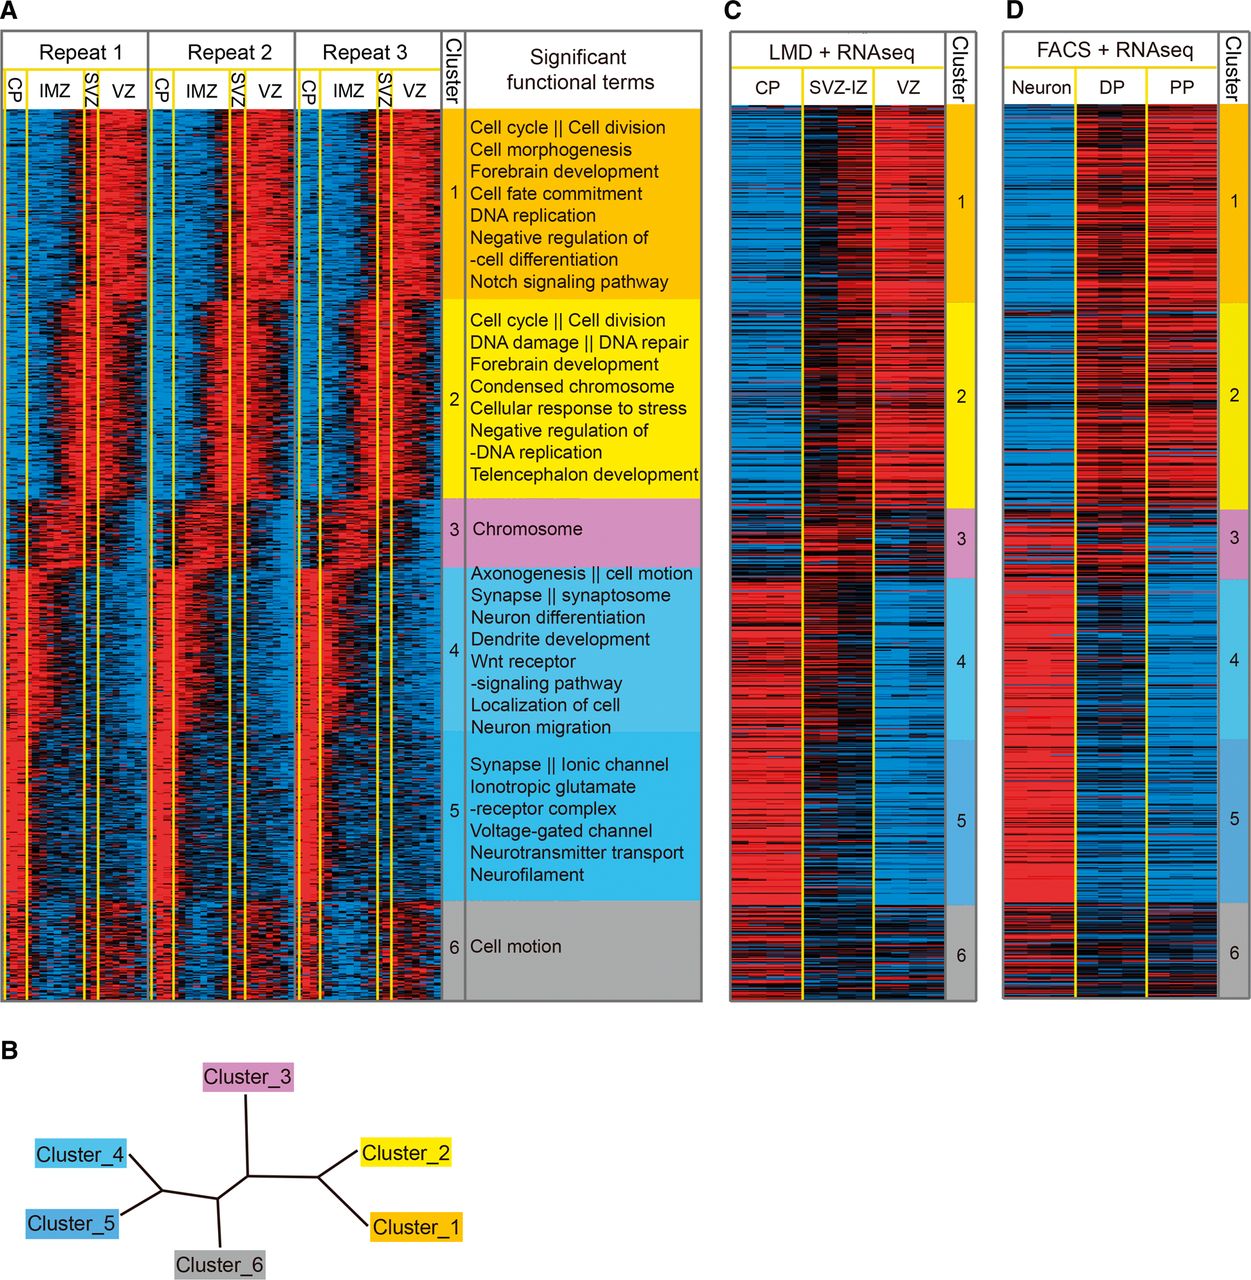
VZ to CP ISH profile-based spatial gene expression clusters. (A) Spatial expression profiles of telencephalon-expressed genes were clustered using the Super k-means algorithm with k = 6 and laid out according to their highest expression location, from the ventricle side moving outward. Cortical layers (Takahashi et al. 1995a,b) can be approximately separated into four zones, the CP, IMZ, SVZ, and VZ, as delimited by the yellow vertical lines. Gene expression profiles were extracted based on gray-scale pixel intensities as illustrated in Figure 1. Each column represents one of the 60 bins from the three neighboring lines marked on each image. Each row represents one of the 1816 images (for the 1598 Entrez genes and 53 miRNAs, all digitized expression intensity values are provided in Supplemental Table S3). The functional GO or KEGG terms enriched within each cluster of genes are listed next to the heatmap. (B) Neighbor-joining tree of the six clusters based on their average expression profiles. (C) RNA-seq expression levels of panel A genes (1561 detected RefSeq genes) in the six microdissected samples from the CP, SVZ-IZ (SVZ-IMZ), and VZ, respectively (two samples from each region and two technical repeats for each sample). (D) RNA-seq expression levels of panel A genes (1521 detected RefSeq genes) in three cell types (three samples from each cell type). (PP) Proliferative progenitor, (DP) differentiating progenitor.


