
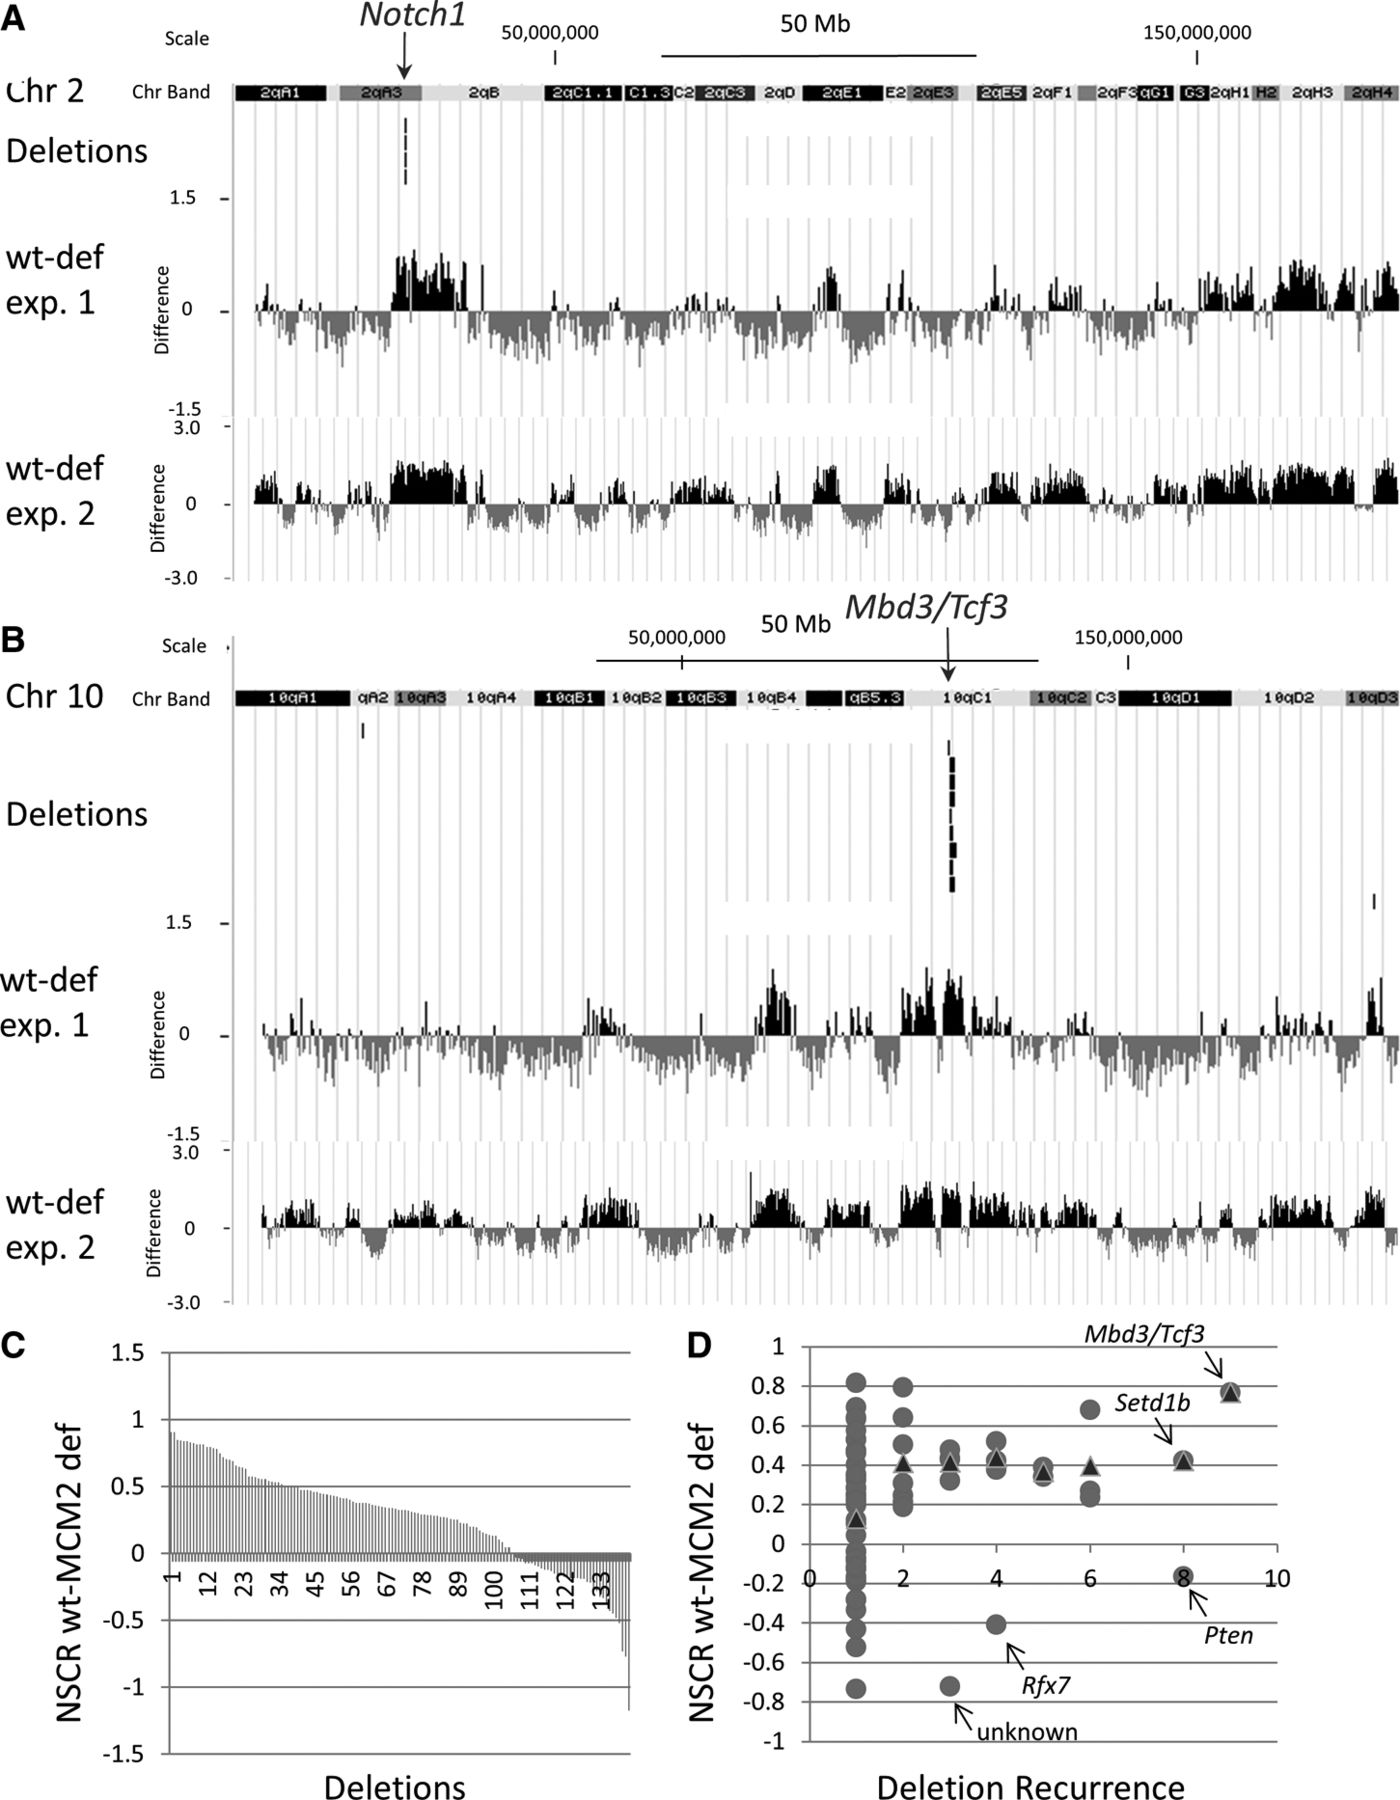
Relationship between the effect of MCM2 deficiency on nascent strand density in MEFs and locations of CNVs in tumors. (A) Region of Chr 2 where recurrent deletions were found in the Notch1 gene (Rusiniak et al. 2012) of thymic lymphocytic leukemias (T-LLs) arising in MCM2-deficient mice as indicated and compared to NSCR wt minus deficient difference values over the same region. (B) Similar comparison for the Mbd3/Tcf3 locus on Chr 10. (C) Plot, in rank order, of the average NSCR wt minus MCM2-deficient values from exp. 1 over the length of each deletion for each of 142 deletions identified in T-LLs arising in MCM2-deficient mice (Rusiniak et al. 2012). (D) The data in D are based on the same deletions as in C, where NSCR wt minus MCM2-deficient values for deletions recurring at the same sites in different tumors were averaged, and the average NSCR wt minus MCM2-deficient value is plotted against the frequency with which deletions recurred (circles). The triangles indicate the average NSCR wt minus MCM2-deficient value for all deletions at different levels of recurrence except that three outliers (Pten, Rfx7, and unknown) were excluded. Similar results were found for data from exp. 2; and for both exp. 1 and exp. 2, bootstrap analysis (Supplemental Fig. S9), and demonstrates a significant (P < 0.001) association between sites of recurrent deletions as well as a preferential effect of MCM2 deficiency on nascent strand density over the deletion intervals.


