
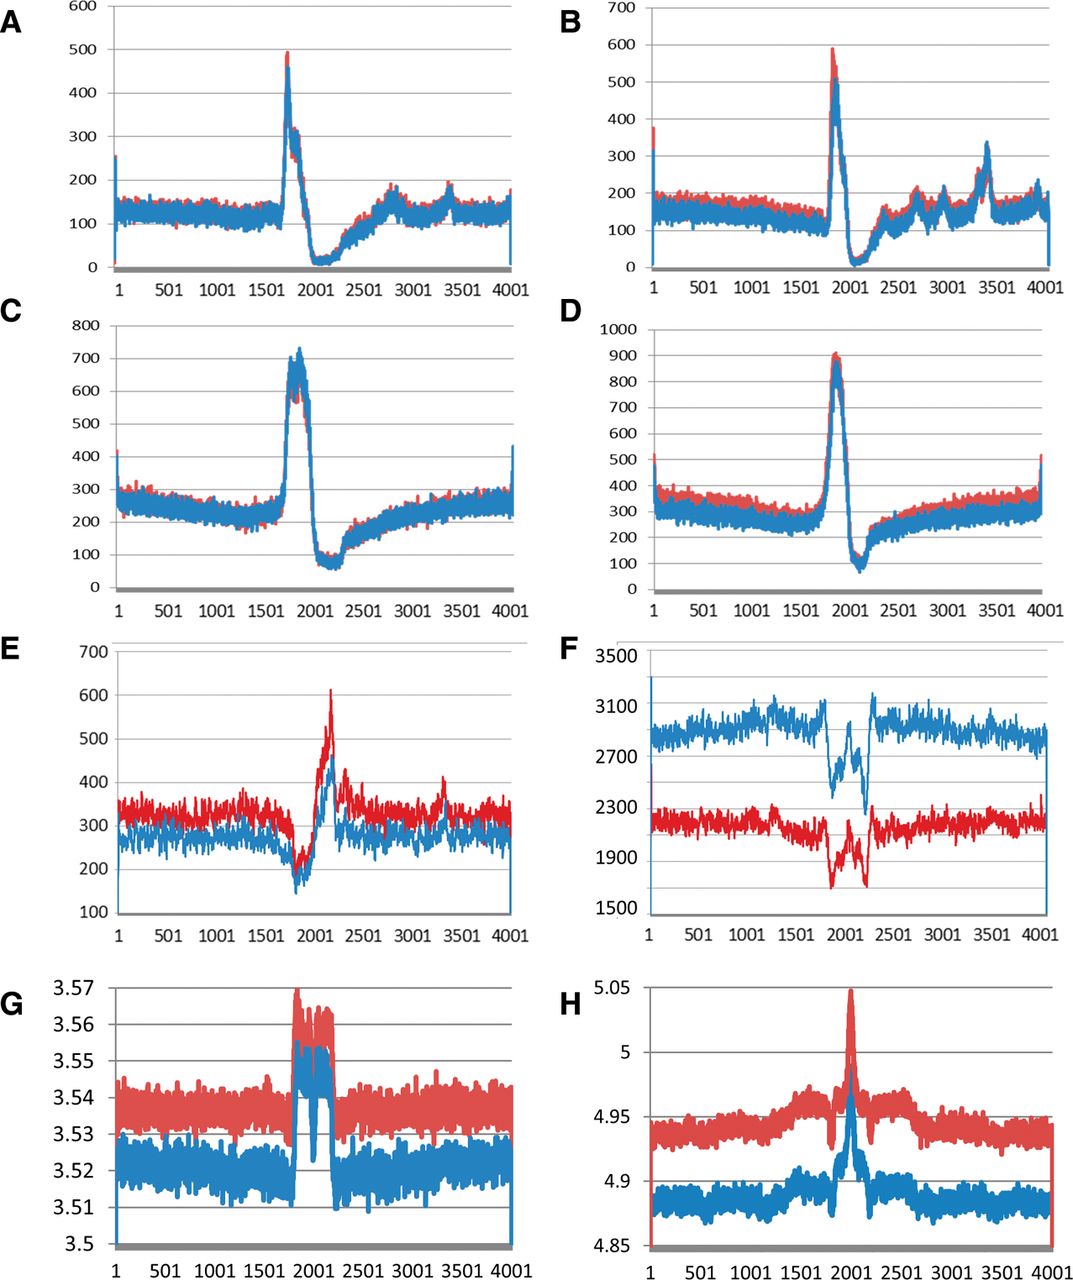
Sequence motifs enriched near to NSCR-SNS peaks. (A–D) Plots of the number of instances (y-axis) that the midpoint of G-quadruplexes (A,B) or TGn ≥ 4 dinucleotide repeats (C,D), oriented relative to the G or TG-containing strands, respectively, occur relative to the location of SNS peak maxima (position 2001) for 4-kbp regions of DNA surrounding each peak. Data from wt cells are shown in red and MCM2-deficient cells in blue, in which A and C show results from exp. 1, and B and D show results from exp. 2. (E,F) Similar plots of motifs enriched in wt unique (E; CYCAGCC) or MCM2-deficient unique (F; ATAWTW) peaks from exp. 1 (wt: red; MCM2-deficient: blue). Plots for additional motifs and for exp. 2 peaks are shown in Supplemental Figures S3 and S4. (G,H) Structural properties of DNA plotted relative to NSCR-SNS peak positions, in which G is average DNA stiffness and H is average consensus DNA bendability for wt (red) and MCM2-deficient (blue) “unique” peaks for peaks that are common between exp. 1 and exp. 2.


